My blog has moved to jimdehner.com
Thank you for all the support over the past 2 years - I recently updated my blog to make it easier to read, improve the rendering of images and tie back to video presentations that are associated with the content - Check it out at UPDATED blog post
YoY and YTD calculations are fundamental business metric - afterall who doesn't want to know how they compared to last year, last month or how they are tracking on a year to date basis. It seems that users at all experience levels have questions on how to complete period over period and period to date type calculations or have different expectations for the outcome. (See the recording VizConnect Tableau Community Data Doctor Session August 2021 - YouTube )
Here we will look at 5 different approaches starting with the most straightforward - table calculations to the advanced duplicating the dataset and joining it to itself.
I will be using subsets of Superstore data in the calculations. (Note:there is a link to downloadable workbook)
1 Table Calculations
The easiest way to do a period over period calculation is with a standard table calculation Percent Difference:
Easy enough, but most users want to eliminate the empty column for the initial year in the series. That can not be done with a table calculation
2 LOD and a fixed starting point
The second method uses 2 LODs and requires a fixed starting point. That starting point be from a parameter, the current date (Today()) or the latest date in the data set {max(date)} The example uses Today() -
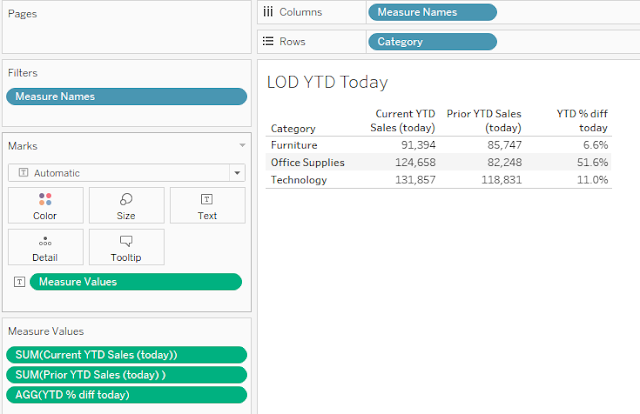
The current YTD value can be determined using the LOD:
{ FIXED [Category]: sum( if DATETRUNC("year",[Order Date])= DATETRUNC("year",TODAY())and DATETRUNC("day",[Order Date])<= DATETRUNC("day",TODAY()) then [Sales] end )}
Where the year of the date dimension is checked against the year of Today() and all the days in the year prior to and including Today() and included in the total.
Similarly the prior YTD value calculation is:
{ FIXED [Category]: sum( if DATETRUNC("year",[Order Date])= DATETRUNC("year",dateadd("year",-1,TODAY())) and DATETRUNC("day",[Order Date])<= DATETRUNC("day",dateadd("year",-1,TODAY())) then [Sales] end )}
and compares the year of the date to 1 year prior to Today() using a Dateadd function.
Then the YoY percent difference is simply calculated using:
(sum([Current YTD Sales (today)])-sum([Prior YTD Sales (today) ]))/
sum([Prior YTD Sales (today) ])
The LOD approach is the one I recommend most often - the LODs for the Current and Prior YTD are portable from sheet to sheet and can be used in any other calculation. They are also easily converted to use with a parameter for the end date or the max date in the data set by substituting [Parameter Date] or {Max(date)} for Today() in the forumlas.
3 Variable period POP
Often users want to compare the YTD versus PYTD or MTD versus PMTD (or more) based on a parameter selection by the end user. First a Parameter is need to select the basis for comparison
then 2 Case statements for the Current or Prior period to date totals - the case statements use LODs similar to those used in the previous example. (Note:The formulas can be downloaded in the workbook).
Selecting the Year returns the YTD (July 9, 2020) versus Prior YTD (July 9, 2019)
And selecting Month will compare MTD (July 9, 2020) to Prior MTD (June 9, 2020)
More levels can be added to the parameter and the case statements to look at different data part levels.
4 Dynamic YoY comparison
Less frequently, a user will want to compare make a YoY comparison over a range of dates and that presents a problem with the first 3 approaches. Table calculations do a comparison by position in a data table, not by the actual date and the LOD solutions depend on fixing an end date.
A dynamic or running YoY comparison can be done but it will take duplicating the data set and joining it to itself offsetting the date by a year. But it can only be done at levels where the data set is solid - i.e. no voids in the data set
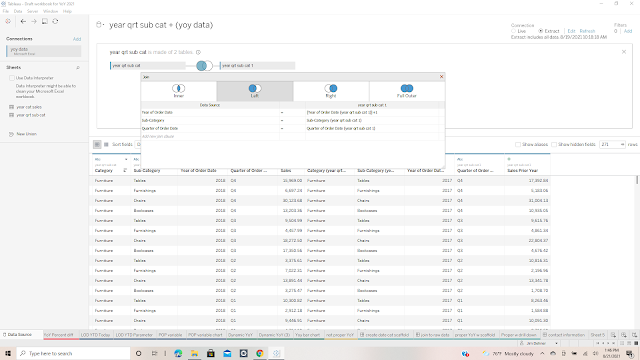
The first example uses a very simple data subset of the Superstore data that only includes the order date, the category, subcategory and the sales value. Step 1 is to join a copy of the data with itself at the subcategory, month and year level but offsetting the year - (Note I have used the physical layer to explicitly join the files together )
When you open any worksheet there will be 2 data sets in the data frame - one is the original data set
and the other is the copy that was joined to create a Prior year data set
The comparison can be made directly by placing the current and prior year sales on in viz and the current years on columns
window_sum(sum([Sales]),-3,0)
and Prior year
window_sum(sum([Sales Prior Year]),-3,0)
They result in this:
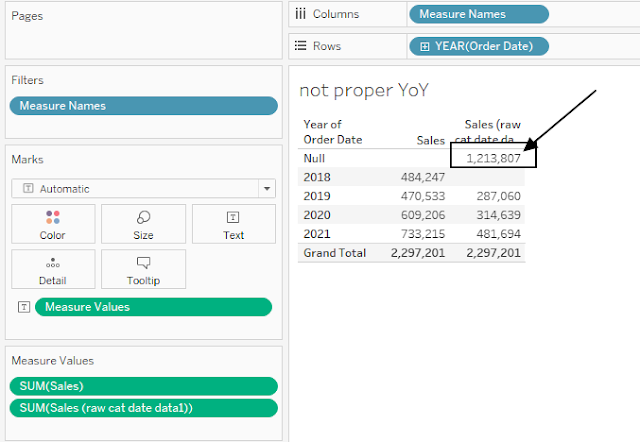
But there is a problem when the data is sparse - where there are nulls or voids in the data.
I expanded the dataset to the Month and day level and that introduced voids in the data
The prior year data will no longer total properly due to the nulls in the data
To correct the problem requires first creating the missing cells. That is done by scaffolding the data - I used Prep to create a ladder at the date/category level and joining it back to the original data
resolving the nulls and the prior year now totals correctly
The workbook use here can be downloaded at :Link to workbook
Jim


No comments:
Post a Comment
Note: Only a member of this blog may post a comment.