Thursday, December 10, 2020

My Top 5 Building Blocks on the Journey from Spreadsheets to Tableau


My blog has moved to jimdehner.com 

Thank you for all the support over the past 2 years - I recently updated my blog to make it easier to read, improve the rendering of images and tie back to video presentations that are associated with the content - Check it out at  Jim's new blog  -   


Presented at  TFF 2020 see  Video Here

Like many of you, I am not a data scientist. Actually, my background is in engineering and marketing.  I started Tableau with a lot of experience with Excel mixed with a bit of Access and I struggled for a while - that may sound familiar.  

Additionally, spreadsheet calculators and Tableau are fundamentally different. Spreadsheets work on a cell basis - values or formulas are in cells - cells can be copied or referenced in formulas to return another single cell value.  Tableau works with dimensions that categorize data and measures that are actual values. Referring to dimension returns all the associated values in the data base - an entire column of values in a spreadsheet - 


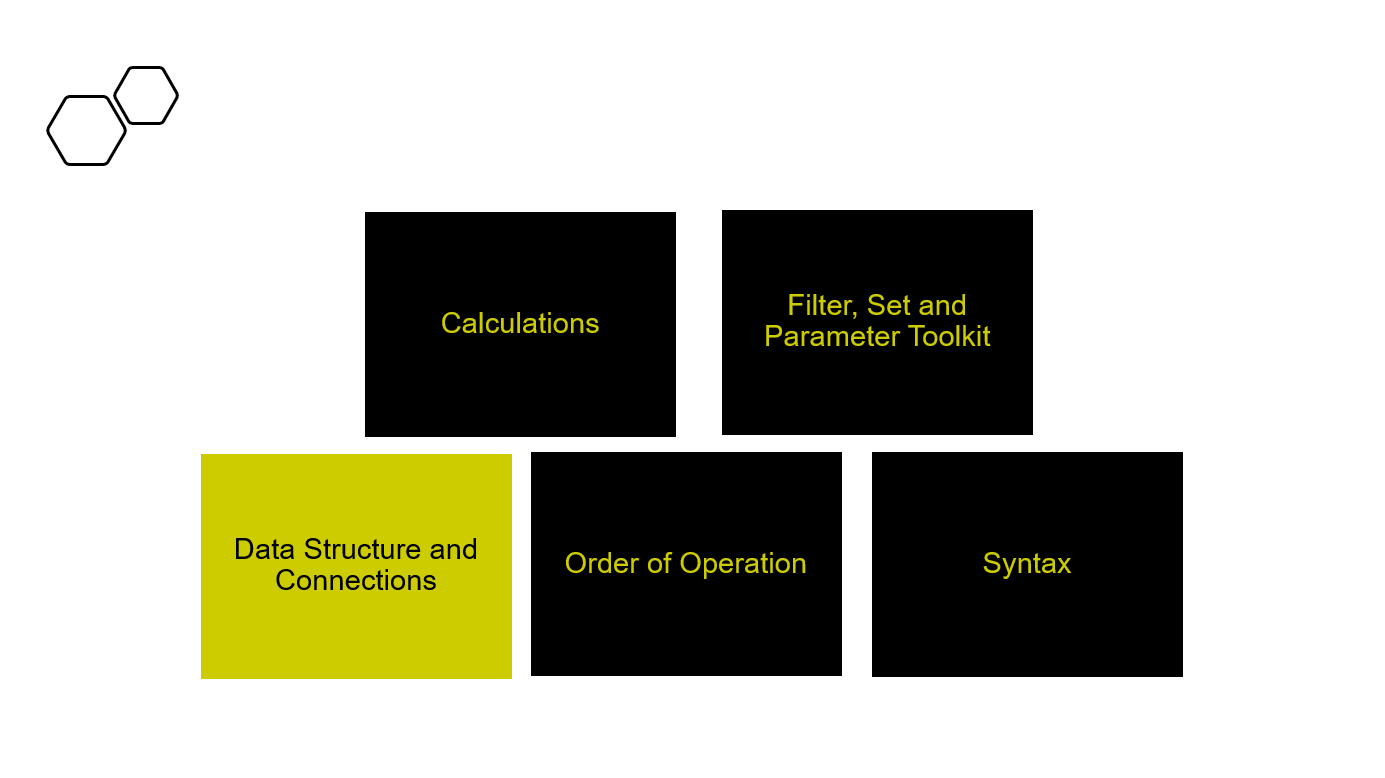
Ok, so what - it meant learning Tableau from the ground up and along the way there were 5 fundamental building blocks that once learned could be combined to create even the most complex solutions.  Below I will present the skills needed and a couple of examples.   Try them out with your own simple data sets. You can't break anything and you will learn a lot in the process.


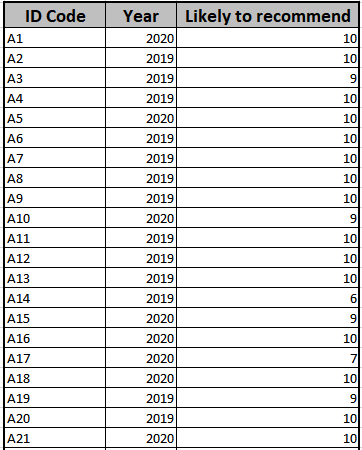
I grew up with a calendar on the refrigerator door - 7 columns for days and 4 to 5 rows for weeks and got comfortable seeing data organized in short wide tables.  Spreadsheets have a similar structure so learning that Tableau needs a tall narrow data table structure is out of our comfort zone.  For example, spreadsheet column headers like dates need to be in a single dimension (column) with each value a different date


The way that is done is to pivot the data on Data Source tab


resulting in the tall narrow data structure needed 


Next you need to understand how to combine data sets - using Joins to add a column or Unions to extend the length of the data 


When you need to add another "column" of data to the table use a Join . In Excel you would use a vlookup 

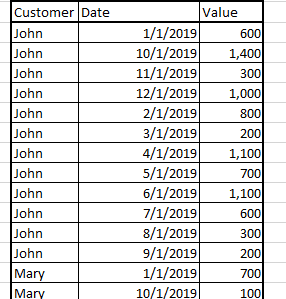
To add Quantity data to the Sales data above with data that looks like this:


The Quantity data need to match Sales by Date and by the Customer - so there are 2 join clauses 


Alternatively,  data that is updated regularly, like monthly Sales, using a Union of the new month to the existing data will append the new data to bottom of the existing


There is one more way to combine data that are at different level of aggregation or come from different data sources - that is Blending -  

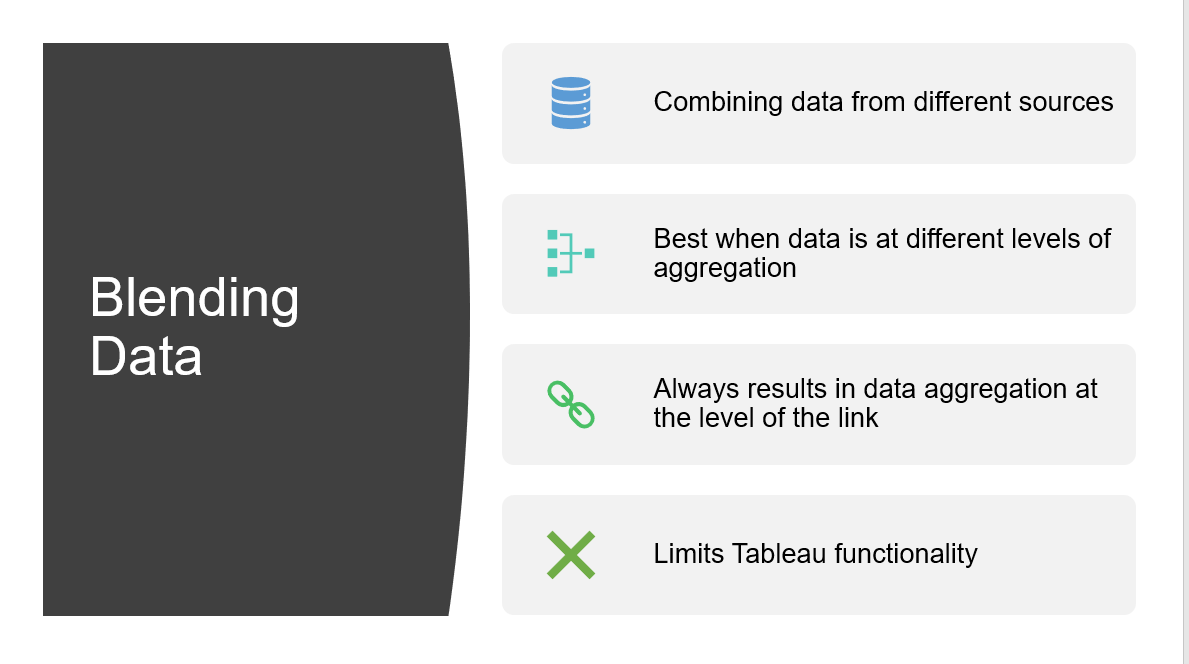
Load your first data source into Tableau then add a second source


Those are basic examples of 3 ways to connect data -  it can be more complex but with practice you will become comfortable selecting which to use  - in later examples you will see how they affect your calculations


 The order of operation is the sequence Tableau follows as it creates a viz.

For each worksheet, Tableau will use a subset of the total data set to create a table that "underlies" the viz. You can think of it like a spreadsheet - its not really - it is the tall narrow format.  Once the dimensional table is built - values are added and manipulated to create the final chart, graph or visual


While there are 10  steps in the order of operation, I find it useful to think of them in 3 groups


The first 2 steps are workbook level and filter the data from the data source - they can be used to improve the performance of the book.  

As dimensions are added to the Rows and Columns shelves and filter applied  (Steps 3-5) the dimensional table for the worksheet is formed 

The final 5 steps load and manipulate the values in the sheet.

A step by step explanation is too exhaustive for this post but is covered in Orderofoperation  on this blog.   

When I first started, I printed (yes on paper) a copy of the order of operation as a reference. Next to syntax mistakes, using steps out of order is the most frequent cause of errors.


While some of the formulas are similar to those in Excel, Tableau syntax is unique  and needs to be learned.  Fortunately, there is a Calculation Wizard to help

If you have written a lot of Excel formulas the wizard user interface (U/I) will look familiar.  Formulas are listed and grouped in categories.  A drop down can filter the formula list making specific functions easier to find.  On the right is an explanation of the formula you are working on and the arguments needed


Autofill and auto suggest are also included -  at the bottom of the frame is the a Syntax is checked as you enter the formula.


The syntax checker will tell you when the formula is valid - that does not mean the logic returns the answer you expected .  

The most common types of errors are due to aggregation / non aggregation, trying to aggregate something that is already aggregated, mis-matched parentheses, or missing an operator -I still make them everyday -  after a while you know how to correct them - see aggregation to learn more about aggregation errors

You didn't learn Excel formulas overnight and the same is true for Tableau - you will find there are a few you use repeatedly that will be like second nature and others that you need to look up. 


Calculations are the backbone of creating more advanced analyses and the visuals that go alone with them.  

There are 4 basic types of calculations in Tableau


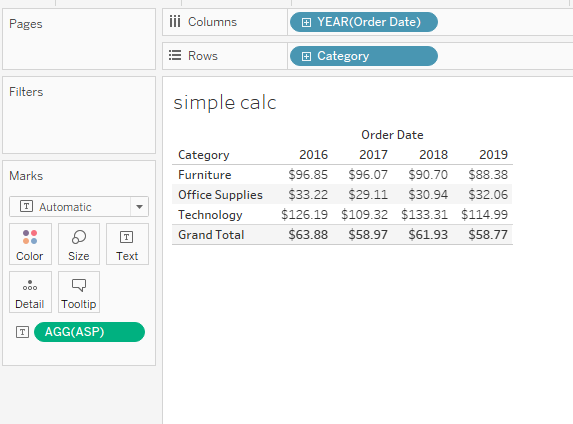
Simple calculations, including "If ... Then " conditional statements look similar to those in excel except they are typically written at an aggregated level - Think back to the data structure, Dimensions and Measures refer to and entire "column" of Excel data - 


so to find the average selling price at the level of dimensions in the viz -

ASP=Sum(sale)/Sum(quantity) 

Will return this when Category is on the Rows


and this


Conditional statements are coded as     If ... Then ... Elseif ... End 
 
This statement would create Sales Groups out of Regions

If [Region]="East" or [Region]= "West" then "Costal"
Elseif [Region] = "Central" then "Middle" 
else "South" end

and return this


Conditional statements can be nested or used in any other type of calculation

The more you write them the more comfortable you will become with them

Dates functions - real dates - are special type of data in the Tableau - they self sequence, sort and most of all can be used in date calculations.  The functions can be discrete or continuous and are based on truncating the full data time series at different levels


Some of the date functions - year, month, quarter, day seem familiar - others like datetrunc, dateadd, datediff will take some getting used to see date functions for more

Like Excel, date functions come in 2 different types

  • Those that return dates - Datetrunc in Tableau or Date Value in Excel
  • and those that return a reference to the date like Month in both systems
Date functions can be used with time also. They are very flexible but do take some practice.  I have several post on converting strings to dates, calculating durations, and excluding weekend to use "Business Days"  - see Date Examples

LOD Expressions - Extremely powerful, LOD's allow you to create additional layers in your data are level above that entered when you loaded the data


While LODs aggregate a measure, they are not aggregates in themselves and can be used in simple calculations, nested in other LOD's, and included in Table Calculation

{Fixed Segment, Region :  Sum(Sales)}

In words says take all the combinations of Segment (4) and Region (4) and total the Sales anew save them for use them later - and you have established a lay in the data set that includes 16 values. 

Table Calculations   With a background in Excel, table calculations will seem familiar.  Like Excel formulas, they operate on the rows and columns of the data table that underlies the worksheet but that is where the similarity ends.

In Tableau there are 2 concept - Scope and Direction that govern how the calculation is applied to the data in the table 


Table calculations come in 3 types

    • Those that aggregate or rank values in the table like 
      • Window_Avg, Running_Sum, Rank_Unique
    • Others used to navigate the table like:
      • Lookup, Previous_Value, First, Last
    • Act as the interface to R or Python
      • Script_Real, Script_Int

You can use the Quick Table Calculator 


Or you can write your own using the Calculation Wizard

The Direction for the calculation will default to Across but can be changed directly using "Compute Using" or opening the Editor 


Filters, sets and parameters give you and the user ways to select, limit and group data.  Just like in Excel, filters limit the data in the underlying table, Data that is filtered out is no longer available for calculations or presentation on the worksheet. Filters can be applied to the workbook level, to dimensions or to measure values after they are added to the table


Measure filters can be applied at the record before aggregation or the after selecting an aggregation level


Sets classify dimensions into 2 groups - the "IN" group selected by the user and all other values are in the "OUT" group. All records are still available in the table allowing comparisons between the In and the Out groups. Sets can be selected manually or by a formula and multiple sets can be  combined to identify items in both or only a single group.  Set actions can be used to change set members by selecting from a value picker or dropdown.  Finally sets are formed in Step 4 of the Order of Operation after Context filters have been applied but before Dimensional filters - giving the user several options when comparing values.  

Parameters allow the user to input a single static value by a selection from a list or direct entry into the workbook.  The value is constant until manual changed and is the same throughout the entire workbook.  

But parameters don't do anything until they are included in a calculation (any type) or a filter.  It is the formula or the filter that does affects the viz not the parameter.  The parameter value is the same everywhere in the workbook but it can be used in different calculations or filters and need not be applied to every worksheet.  Changing the parameter value will affect all the calculations or filters where the parameter is used.  Parameter actions can be used to change the parameter value visual elements on the worksheet


The parameter list can be updated dynamically when the workbook is opened - 


Those are the 5 building blocks on the road to understanding Tableau. Combined simple calculations were used to create the viz below.  It uses a parameter action to select the date, set action to select states and segments, LOD's for YTD and YoY calculations 


It may seem formidable but with a little work on each you will develop a deep understanding of how Tableau works.

The workbooks that accompany these examples can be found at Tableau Public Link


Jim


Wednesday, November 18, 2020

FAQ Series - Net Promoter Score

My blog has moved to jimdehner.com 

Thank you for all the support over the past 2 years - I recently updated my blog to make it easier to read, improve the rendering of images and tie back to video presentations that are associated with the content - Check it out at  Jim's new blog  -   


Recently I had someone ask about calculating the Net Promoter Score in Tableau. It's not difficult but first a word on what the NPS is and who uses it -

The Net Promoter Score is often used by consumer products companies to measure customer loyalty. It is easy to administer - just collect consumer responses to "How likely are you to recommend our product/service to a friend or colleague?  Responses are retrieved on a 0 to 10 scale.   Response ratings of 9 or 10 are "Promoters", those rated 6 or less are "Detractors"  and the 7 and 8 group are "Passives" -  the NPS is the percent to total for Promoters minus that for Detractors based on the count or responses in each group and overall.


Pretty simple, repeatable, and has been show to produce consistent results.  So how to use Tableau to calculate the results?

Typical survey data might look like this  


A code to identify the responder, date (here just a year but you may have data on a monthly basis) and a response to the "Likely to Recommend) question - numeric value form 0-10

Start by classifying each response as "Promoter", "Detractor" or "Passive"

If [Likely to recommend]>=9 then "Promoter"
elseif [Likely to recommend]<=6 then "Detractor"
else "Passive" end


Then the Percent to Total can be done with an LOD


sum({ FIXED [Year],[Promoter Classification]:countd([ID Code]) })/
sum({ FIXED [Year]:countd([ID Code]) })


then the NPS is just the difference between the Promoter and Detractor percentage


{ FIXED [Year]:
(sum({ FIXED [Year],[Promoter Classification] : ( if Min([Promoter Classification]) = "Promoter" then [lod percent by class] end) })
-sum({ FIXED [Year],[Promoter Classification] : ( if Min([Promoter Classification]) = "Detractor" then [lod percent by class] end )}

and then the results look like this


and the Net Promoter Score is the difference between the percentage of Promoters less the Detractors 


It no more difficult than that.  

To learn more about Net Promoter Scores see :NPS Source

The workbook contain the calculations used here can be found at: Link to NPS workbook


Enjoy

Jim


Saturday, October 17, 2020

FAQ Series - Fiscal Years


My blog has moved to jimdehner.com 

Thank you for all the support over the past 2 years - I recently updated my blog to make it easier to read, improve the rendering of images and tie back to video presentations that are associated with the content - Check it out at  Jim's new blog  -   


Many businesses use a fiscal calendar for accounting and reporting . Their fiscal year can start on the first day of any month and may not align with the start of a calendar quarter.  Tableau makes it easy to adjust for the fiscal year start.  

Open the date field and set the Default Property - Fiscal Year Start to the proper Month


The fiscal year starts in the month selected (August in this example) and ends 11 months later (July) in the subsequent calendar year 

Quarters are 3 month periods starting with the fiscal year start


The date field can be used in any type of chart, can be filtered, or placed on tile cards to adjust to the proper fiscal year


But problems arise when doing any of calculation based on date functions 

In the LOD below the Year(Order Date) is the calendar year - not the anticipated fiscal year 

{ FIXED Year([Order Date]):sum([Sales])}


Date functions don't recognize fiscal years so a different approach is needed 

This example came from a recent TCish BrainDate- The user has an August fiscal year start and wanted the to be able to select any calendar date and display the current and the prior  YTD and QTD sales 

(Note: in the US retail sector February and August fiscal year starts are not uncommon - Inventory taxes are often evaluated on inventory levels at the end of January  so retailers set the FY start in February or 6 months later - manufacturers who sell into the segment frequently want to be able to see reports or analyses in the retailer Fiscal Year)

Conceptually, the approach is simply determining the fiscal year start date based on a parameter and the Current Date (a calendar date) set by another parameter - used as the end date for YTD and QTD analysis.  

Note: The formulas to determine the quarterly adjustment between the fiscal quarters and the calendar month were difficult and took some trial and error - for that reason I included them in the text so you could copy and paste them - the other calculations deciding which calendar dates are between the start and end dates of the fiscal period. 

Start by creating a parameter to select a start month - The values are 1-12 and the display is the Month to make it easy on the user


another parameter is simply a date parameter 


The FY start date is just based on the Start date parameter converted to a real date

  Dateadd('year',0,[Convert Start date to Real date])

But finding the month of the quarter start date will take a series of calculations  

The basis to determine which Calendar Year the contains the Fiscal Quarter start -  if the value is positive the Current Date and the FQ start are in the same calendar year - if the value is negative the FQ starts in the prior calendar year

month([Current Date]) - Min(Int([FY Start Month Parameter]))

The adjustment that will be used in Dateadd function is actually

If [Number months Current date and FY Start]>= 0

then [Number months Current date and FY Start] 

ELSE 12+[Number months Current date and FY Start] end


The FQ for the Current date is 

If  [Month adj to FQ1] <=2 then Dateadd('month',0,[Start Date - Real])
ELSEIF   [Month adj to FQ1] <=5 then Dateadd('month',3,[Start Date - Real])
ELSEIF   [Month adj to FQ1] <=8 then Dateadd('month',6,[Start Date - Real])
ELSEIF   [Month adj to FQ1] <=12 then Dateadd('month',9,[Start Date - Real])END


For the prior year fiscal year start the formula simply is:

Dateadd('year',-1,[Start Date - Real])

The prior quarter is 

If  [Month adj to FQ1] <=2 then Dateadd('month',-3,[Start Date - Real])
ELSEIF   [Month adj to FQ1] <=5 then Dateadd('month',0,[Start Date - Real])
ELSEIF   [Month adj to FQ1] <=8 then Dateadd('month',3,[Start Date - Real])
ELSEIF   [Month adj to FQ1] <=12 then Dateadd('month',6,[Start Date - Real])
END

The formulas of the YTD QTD prior YTD and Prior QTD are straight forward LODs that total the sales between the period start and end dates

YTD sales for the Current Fiscal year

{ FIXED [Order Date]:(if min([Order Date])>=[Current FY start date] 
and min([Order Date])<=[Current Date] then sum([Sales]) end)}

QTD sales in the current FY

{ FIXED [Order Date]:
If Min([Order Date])>=[Current Q start date] and Min([Order Date])
<=[Current Date] then sum([Sales]) end }


Prior fiscal year YTD sales

{ FIXED [Order Date]:(if min([Order Date])>=[Prior FY start date] 
and min([Order Date])<=DATEADD('year',-1,[Current Date]) 
then sum([Sales]) end )}


Prior year fiscal quarter sales 

{ FIXED [Order Date]:if Min([Order Date])>=[Prior Q start date] 
and Min([Order Date])<=DATEADD('month',-3,[Current Date]) then
sum([Sales]) end }

and the YoY and QoQ formulas are LOD's 

sum({ FIXED :(sum([Current Year YTD sales])-sum([Prior Year YTD sales ]))})/
sum({ FIXED :  sum([Prior Year YTD sales ])})

and 

sum({ FIXED :(sum([Current Year QTD sales])-sum([ Prior QTD sales]))  })/
sum({ FIXED :sum([ Prior QTD sales])  })

In table form the user can select the starting dates and the table updates to return the year and quarter to date values 


A look at the monthly detail makes it easier to see what the formula do 

The current YTD include the months of August - December 5th, QTD is November  - December 5th

The prior YTD is in FY 17 August 2017 - December  5, 2017 and the prior QTD is in FY 18 August 2018 - September5, 2018


Hope it makes sense to you

The workbook which contains all the complex formulas can be downloaded at Link to Tableau Public


Enjoy

Jim

Sunday, August 30, 2020

FAQ Series - Business Days


My blog has moved to jimdehner.com 

Thank you for all the support over the past 2 years - I recently updated my blog to make it easier to read, improve the rendering of images and tie back to video presentations that are associated with the content - Check it out at  Jim's new blog  -   


Often you only want to use "Business Day" in your viz or move the weekend sales to Friday or Monday -


In the examples here I will us the US standard Sunday - Saturday week with a Monday - Friday "Business Week"  - 

1-Weekday Labels

Tableau has a couple ways to identify and label dates by the day of the week - 

A straightforward way is take advantage of the Custom Date option

Open the Date dimension - then Custom Date - then Weekdays from the dropdown


Alternately - you can use Datename in a calculated filed - the argument 'weekday' must be the literal as shown in quotes

DATENAME('weekday',[Order Date])

Or use Datepart to assign a number to the weekday - 1 for the first day of the week (Sunday in my examples) and 7 for the last day (Saturday)

DATEPART('weekday',[Order Date]) 


Sales by day of the week is  easy to get - but how to you move the weekend sales to Friday - You can use an "IF ... Then " type of conditional or a Case statement like this


CASE [Order Date (Weekdays)]

When 2 then "Monday"

When 3 then "Tuesday"

When 4 then "Wednesday"

When 5 then "Thursday"

Else "Friday-Sunday" End


2- Examples

The day of the week dimension can be used like any other dimension to categorize data - 

or in any type of calculation

Some users want to look at how their average sales vary by the day of the week


3-Holidays

Holidays, including those that are unique to region or business culture, often need to be removed from the dataset - 

One way is to create a separate dataset of the date and the holiday name:


Left join the holiday file with your data set on the date field


and then use a Data Source filter to delete all the holidays from the data


4-Look back N business days

Some users want to find a value in the several days prior to the current day - It can be done easily with a datediff function when all 7 dates are included.  But to look back N days excluding weekends is more complex.  

The example below is broken into individual formulas that you can combine in your own workbook - also it determines the number of calendar days to look back based on the business need to express the look back in business days - the solution uses actual date values so dimensional filters can be applied without affecting the calculation 

First the Lookback period in business days is set using a parameter (just a simple integer)


To simplify some of the I wanted to wanted to use Monday as the first day of the week and used the previous Datepart week formula in:

if [date part weekday]>=1 and [date part weekday]<=7 then
[date part weekday]-1 else 0 end

You may be tempted to use datepart('weekday',[date],'monday')  - unfortunately datepart only supports weekday for weeks that begin on the default - in my case Sunday

Next we need the number of 5 day weeks back based on the value of the Business Day Back Parameter - the Min Number of Weeks is:

Int(([Number of day back]+1)/5)


but that is the number of whole weeks and it needs be adjusted for the position of the date within the week - for that use a function called modulo - the function returns the remainder of the division of the argument (the parameter value +1) divided by  5  

([Number of day back]+1)%5

The total number of weekend then is
 
{ FIXED [Order Date]:(
if min([jd datepart start monday])=0 then Min([JD Number of weeks ] )
elseif min([jd datepart start monday])<int(Min([jd modulo day of week]))
then Min([JD Number of weeks ])+1 else Min([JD Number of weeks ] )end ) }


The formula used to add in the Saturday/Sunday weekend days to the Business Days Back parameter to determine the number of calendar days to use in the date diff calculation

int(min([Number of day back]))  + 2*(min([number of weekend days]))

finally the calendar date for N Business days in the past can be determined as

{ FIXED [Order Date] :DATE(dateadd('day',-[JD number of dates back],Min([Order Date])))   }

For example using December 2019 Superstore data looking back 7 business days would return :


Great but real business questions are usually about the growth from the over the period or the total sales looking back over all the dates.  To get that we need a start date and a parameter. First determine and fix the calendar date based on the start date and the number of business days to look back

{ FIXED : min(if [Enter start date]=[Order Date] then [JD date of back dated] end )}

then the value on that date becomes:

IFNULL({ FIXED :sum(if [JD Fixed back date from param]= 
[Order Date] then [Sales] end)}  ,0)

 
The ifnull adjust for dates where there were no sales

The value on Start Date is simply

IFNULL({ FIXED [Order Date]:   sum( if DATETRUNC('day',[Order Date]) = 
DATETRUNC('day',[Enter start date])  then    [Sales] end )} ,0)

And the percent difference is:

If (sum([JD value at lookback date]))=0 then 1 
elseif (sum([jd value on start date parameter value]))=0 then 0
else(sum([jd value on start date parameter value])-  sum([JD value at lookback date]))/sum([JD value at lookback date])
end


All the calculations are LOD's and can be used to create a simple summary table 


Determining the the total sales over the "lookback period" will require another LOD

IFNULL({ FIXED :sum(
if [JD Fixed back date from param]<= [Order Date] and 
[Order Date]<=[Enter start date]
then [Sales] end)}  ,0)


Lots of LOD's and can be confusing but necessary to avoid table calculations which are based on a position in a table and not an actual date.  

There could be many more examples and variations on viewing sales by business day. I encourage you to try some of your own - 

The examples here are captured in a workbook that has been posted to my public site at 

Jim


Post splash image

My Blog Has Moved