My blog has moved to jimdehner.com
Thank you for all the support over the past 2 years - I recently updated my blog to make it easier to read, improve the rendering of images and tie back to video presentations that are associated with the content - Check it out at Jim's new blog -
Recently I had someone ask about calculating the Net Promoter Score in Tableau. It's not difficult but first a word on what the NPS is and who uses it -
The Net Promoter Score is often used by consumer products companies to measure customer loyalty. It is easy to administer - just collect consumer responses to "How likely are you to recommend our product/service to a friend or colleague? Responses are retrieved on a 0 to 10 scale. Response ratings of 9 or 10 are "Promoters", those rated 6 or less are "Detractors" and the 7 and 8 group are "Passives" - the NPS is the percent to total for Promoters minus that for Detractors based on the count or responses in each group and overall.
Pretty simple, repeatable, and has been show to produce consistent results. So how to use Tableau to calculate the results?
Typical survey data might look like this
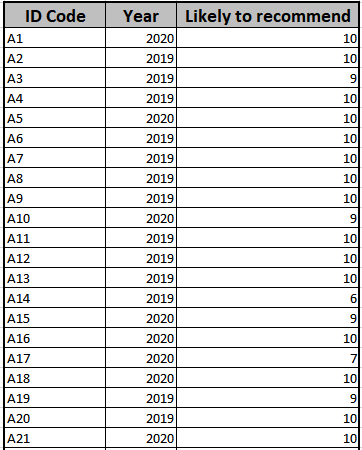
Then the Percent to Total can be done with an LOD
then the NPS is just the difference between the Promoter and Detractor percentage


