Wednesday, March 25, 2020

3 Dimension Charts

I'm a fan of 3-dimensional charts. You may be also and are familiar with how some spreadsheet systems have an option for 3 - Bar or line charts.  I get it. Some business managers just see the story better that way and besides they are cool.

Well, Tableau doesn't have a standard 3-D chart type but with some prep work on the data and extending the data densification concepts used to plot curves it is possible to get close.


To start if you are not familiar with data densification, Ken Flerlage has done an outstanding job of presenting the topic in a straight forward and understandable way - see:          https://www.flerlagetwins.com/2019/05/intro-to-data-densification.html

To extend those concepts to 3 dimensions think about a cube rotated in space and projection the position of points on the cube back to the 2-D display 


Points on the cube are transferred back to the viewing plane using the cube's rotation around the horizontal and vertical axes.  There is some math involved and for those who really understand 3D projection, the approach is not a true prospective - just a transfer of point onto a 2D XY plane.

There are a series of calculations that are needed (I will include them here but a downloadable copy of the workbook will be on my Tableau Public site - and you can just copy them from the book)  Using Superstore dimensions fore Order Date and Sale and relating them to the X, Y and Z dimensions of the cube:

  • Month numbers 1-12 are the X cube axis
  • The Sum(Sales) in Thousands are on the Y cube axis 
  • The Years are the reference on the Z cube axis 2017 = 1, 2018 = 2 etc 


Data Structure

After duplicating, data restructuring is needed - In each year (Partition) the original data are sequenced low to high and the copy high to low:


The data are grouped by  Year(Order Date)  the Z value is just an way to increment the year along the Z axis 1 for 2017, 2 for 2018 etc - 

With Tableau Prep the copying, sequencing and restructure the data can be accomplished in a few steps


1- Bring 2 copies of the data - The original file needs no changes - Sequence is from Min X to Max X values

2 - In the Copy - the data Sequence numbering needs to be from the Max X value to Min X
  • Determine the Max Z value ( Here 4)  :  { FIXED :max([Z])}
  • Find the Total number of records : {{Fixed Year : Countd([Month(X)]}}

  • Renumber the "New Sequence"  : (([fix max z]+([Z]-1))*[Fixed LOD1])+(([Fixed LOD1]+1)-[month(x)])
3- Union the files and revise names and remove unneeded columns


4- In the final step convert all the Y values from the copy data set to 0 :

if [Table Names]="Table 1" then [Sales/1000 (Y)] else 0 end

Then output a file for Tableau - 


Transformation Formulas 


Set up 2 parameters for the rotation around the Horizontal (view X axis) and Vertical (view Y Axis)  -


Tableau uses radians, convert the parameter values to radians:

Vertical axis rotation : ([Vertical axis rotation (degrees)]/360)*2*pi()

Horizontal axis rotation  :   -([Horizontal axis rotation]/360)*2*pi()

Note the negative sign on the horizontal rotation  

The transformation of point to the 2D X dimension is  

-([Month(X)]*cos([vert axis radians])-(3*[Z])*sin([vert axis radians]))

and for the 2D Y dimension

-(cos([hor axis radians ])*[Sales/1000 (Y)]

-[Month(X)]*sin([vert axis radians])-([z axis gap]*[Z])*cos([vert axis radians]))

Note the Z parameter for the "Z axis gap" is a parameter to adjust the spacing in the final viz.

Create the Viz

The VIZ uses the 2D X and Y calculations on columns and rows - add Z to the detail marks card and Sequence to path - 

I include the axis rotation and Z Gap spacing parameters to allow the user to adjust the view


When creating the dashboard I used sheet swapping and added a "Change parameter" set to hover for navigation 


Would love to hear from you on this and see what you have done


Enjoy

Jim

Tuesday, March 24, 2020

FAQ Series Order of Operations

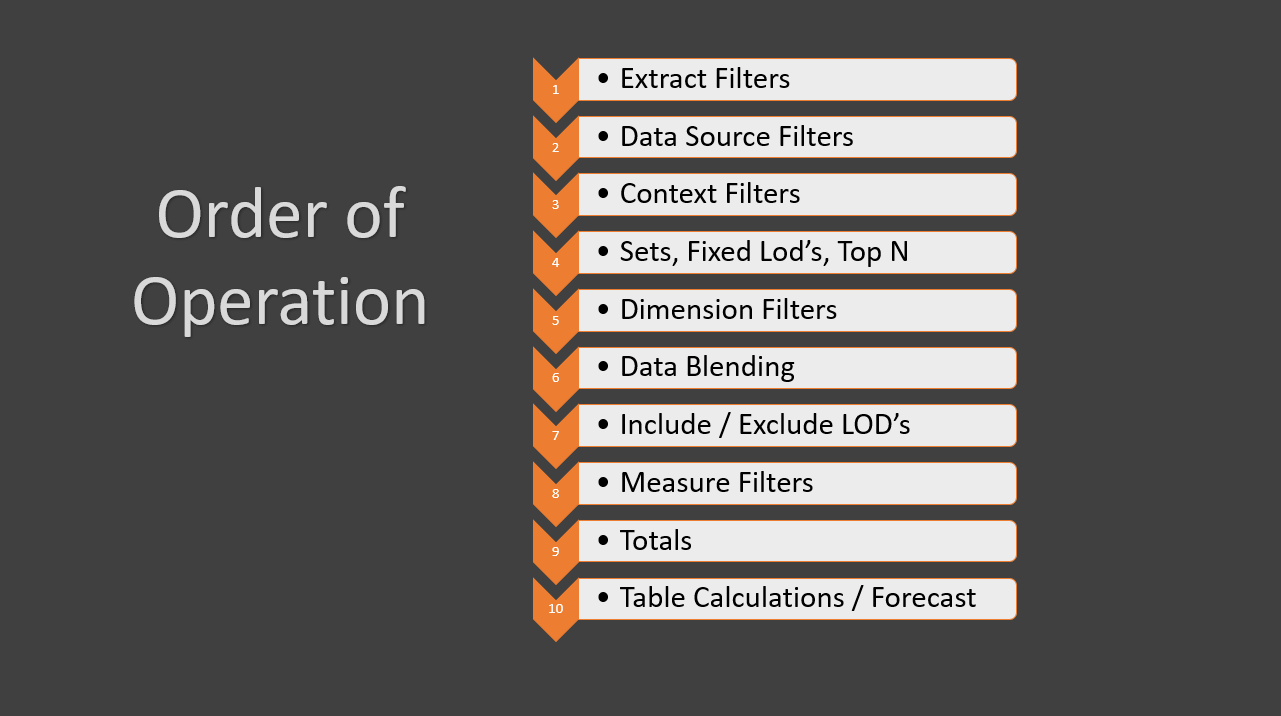
So Just how does the Order of Operations affect your calculations?

Tableau, like most systems has an order or sequence in which filters are applied and calculations are executed.  The process starts at the top and proceeds to the bottom in a single pass.  Calculations executed lower in the order depend on all the steps that precede them.  


Steps 1 and 2 - Extract and Data Source Filters

First just a quick work on the first 2 filters - Extract and Data Source work as data is loaded from the source and limit the amount of data available workbook. 

The remaining filters are executed in the context of a worksheet and limit the data that is included in the table that underlays that sheet - filters on a worksheet can be applied to other sheets to limit the underlying table on those sheets also.


Step 3 - Context Filters:

Placing a dimension "In Context" will apply the filter before any calculations are executed, the Top N is determined or Sets are formed. - The data associated with the filter is not on the worksheet's underlying table and is therefor not available to remainder of the order of operation.

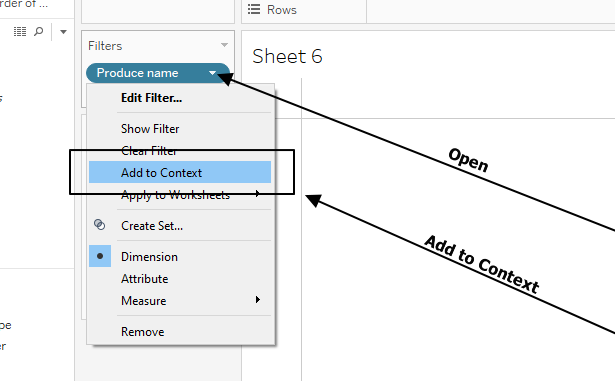
Just open the drop down and select Add to Context


Step 4 Sets, Fixed LOD and Top N 

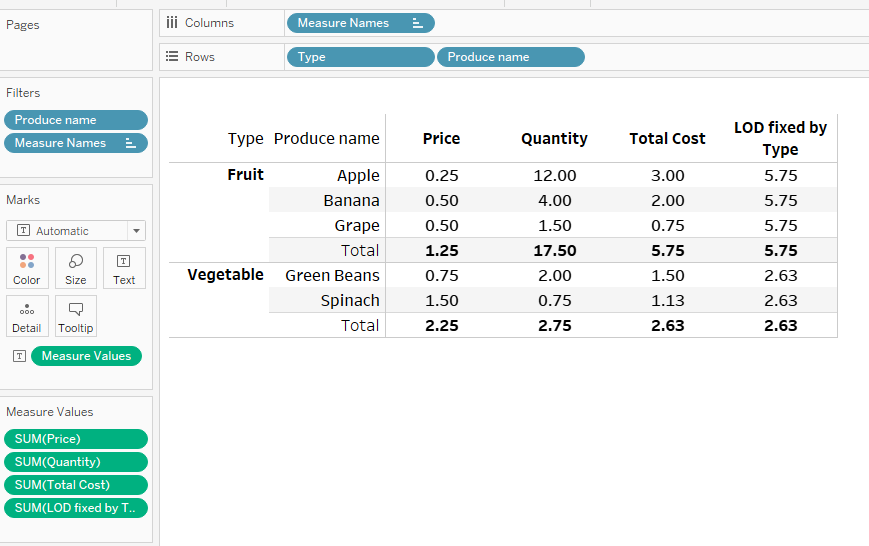
I'm going to use this simple table in the next few examples to show the affect of context filters


After adding Total Cost =  (Price*Quantity) and an LOD: { Fixed Type :sum(Total Cost)}

A text chart like this would result with no filters applied - and the LOD value for Fruit is 5.75


Now see the Context filter effect on the LOD - 

Start without the Produce Name in Context, Banana has been filter out but the but the LOD value remains unchanged - the LOD is calculated before the dimension filter is applied


Place Produce Name in Context 

Banana is filtered out in the Context filter before the LOD is calculated so the count of values in Fruit is now just 2 and the LOD total is reduced to 3.75 - 


Sets are affected by using a context filter also.  The set will contain the Top 3 Produce Names


With no filters applied and nothing in the Context filter,  Apple, Banana and Green Beans are the Top 3


If we filter out Banana without placing Produce Name in Context only Apple and Green Beans are in the result - 2 Produce Names - Not 3?  

The Set is determined on the entire data set - before the Dimension filter is applied - Later, after the Set is formed Banana is filtered out 

But if Produce Name is placed in Context and Banana is filter out before the set is formed 3 values are returned Apple, Green Beans and Spinach (Remember Banana is no longer in the data table for the worksheet)


Let's see what happens with a Top N Filter

Start with a filter on Produce Name set for Top N =3


Create a viz and add a filter on Type - with no filters applied and nothing in Context.

The Top 3 are Apple, Banana and Green Beans 


Filter out Vegetable from Type but do not place in Context


And only 2 values are returned Apple and Banana - the three Top N values were determined  before the Dimension filter is applied - and included 1 vegetable - Green Beans.

Later when the Dimension filter filters out  Vegetable there are only the 2 Fruit values remaining in the Top N

Bu when Vegetables are filter out in Context, the  Top N are determined only from Fruit and 3 values are returned - Apples, Bananas and Grapes - 


Step 5 - Dimension Filters

Dimension filters come in a discrete and a continuous version - The discrete dimension filter should feel familiar if you have ever used a filter on a spreadsheet. The process is the same - just select the dimension values to include in the view -  

Using the Superstore data set that came with Tableau 

Start with a simple bar chart of sales by year and segment - no filters applied 


Apply a filter on Segment and the segment is removed from the view - 


The dimension does not need to be on the rows or the columns in the view - the data will will be filtered from the data table and the view adjusted


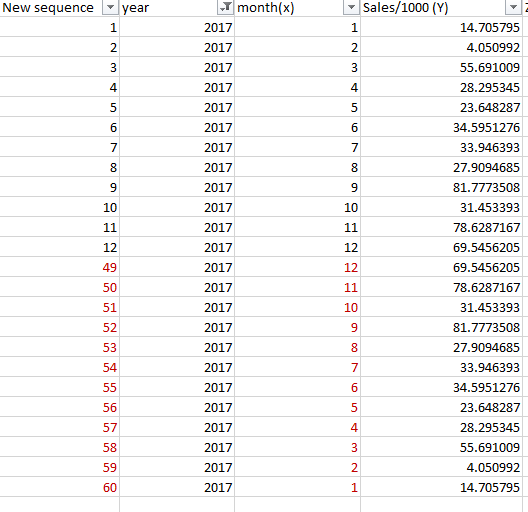
Dimension filters can also be applied to continuous data - Here a range filter with start and stop dates to a date field  


Or as a relative filter - like the last 6 Quarter shown below


Dimension filters are applied to the underlying table for the worksheet  after the context filter and set, top N and Fixed  LOD calculation noted earlier.   After they have been applied the table has been set and further calculations or filters are only applied to values in the table .

Step 6 - Data Blending 

The topic is much too broad for a full discussion here but note where Blending occurs - After Fixed LOD's and dimension filters have been applied. Blending results in data that is aggregated at the level of the link (relationship) among the data sets - but further dimension filtering or use of LOD's across the blended data sets is not available.


Step 7 - Include and Exclude LOD's

Include and Exclude are the less frequently used pair of LOD expressions -

Based on their position in the Order of Operation they operate on the data table that results after the application of all Dimensional and context filters -

So if the table is what what do they do

Include and Exclude refer to the visible portion of the table that is in the Viz - Include will use dimension in the table NOT visible in the viz into the calculation  - Exclude will not use dimensions visible in the view -- 

Lets see how they work:

For these examples, we will use a small product sales data set - 2 Customers, 2 Product Lines, 4 Products and a variety of colors


Add an Include LOD at the Product level - 


When the viz includes the Product level and lower the average from the LOD and a simple average on quantity return the same result


As the hierarchy is compressed the value from the LOD is fixed at the product level


and  return the average at the product level even when it is no longer in the view


Exclude will eliminate the dimension from that calculation and the expression will be based on the next higher level in the view

With the same data set and


will return this when the detail is below the level of Product  - the same a simply summing the quantity


but as the hierarchy is compressed the values is locked at the Product level


and remains at that level 


Step 8 - Measure Filters

Measure filters limit the view based on the values in the data table (not the categorization created by the Dimensions) and can be applied to the aggregate level or the row level data.

When you drag the measure to the rows shelf a window will open giving you to filter at the Row Level "All Values" or at any of the noted levels of aggregation - 


Continuing with the previous data set and filtering for the Sum(Quantity)  - a continuous range filter will open - 


Change the filter and any total value form the view that is not in the filter range is filtered out


when the hierarchy is collapsed to Product Line the only 2 totals that in the range are 14 and 19 - the 94 and 62 are filtered out of the viz


Now, look at how the Row Level Measure filter produces a different result

The filter in NOT an aggregate (no SUM() around the measure)
But for this view the result is the same as the aggregate example


Collapse the hierarchy as before the results are different - and 2 totals 37 and 55 are not filtered out -  Why?  - 

The filter is applied at the row level in the data table and all the values between 10 - 35 are included - Then when the measure is brought to the viz they are summed - 


Step 9 - Grand Totals 

Much like Blending Data - Grand totals are a large topic and will be addressed in a later posts - But note that Grand Totals are before Table Calculations - 

Step 10 - Table Calculations

As the name implies, Table Calculations are applied to the underlying table for the individual worksheet.  At the bottom of the order of operations, they work with the fully filtered data and are always aggregates.  They also can't be used in calculations that precede them in the order of operation - e.g. Table Calculations, Sets , or Top N - 

They are extremely powerful tools used to compare data, total, look up or provide running sums across or within the data table -understand their position in the order of operation is at the bottom and the data table has been set. Using Table Calculations will be the subject on another FAQ so come back.


Hope this helps provide a better sense of what the order of operation is and how it is important when creating your viz

A workbook containing the examples used here can be found and downloaded from 
https://public.tableau.com/profile/jim.dehner#!/vizhome/OrderofOperations_v2019_3/Dashboard3


Enjoy and let me know if you have questions
Jim

Monday, March 9, 2020

Parameters and Parameter Actions

My blog has moved to jimdehner.com 

Thank you for all the support over the past 2 years - I recently updated my blog to make it easier to read, improve the rendering of images and tie back to video presentations that are associated with the content - Check it out at  Jim's new blog  -   


Do you use parameters - I love them and use them a lot - Let's look at them in more detail

Parameters are one way users can directly input a value into Tableau.  

They are:

  • Single valued –  have one value at a time 
  • Static the value is constant until manually changed by the user 
  • Global – they are available for use throughout the workbook. 

But they don’t do anything until they are used in a calculation, a set, or a filter.  

The same parameter can be used in any mix of calculations or filters on a single any combination of worksheets or dashboards.  Changing the value of the parameter will change the calculation or filter wherever it is used.  The change takes places as the sheet is opened.


There are 3 steps to follow when using parameter

  • Create it
  • Put it in the viz
  • Use it in a calculation or filter

1-Create it

Parameters can be created directly from the data


Or from the Filter or Set Top N  tabs


Select Create Parameter - when the window opens  set up the parameter
  • Add a meaningful name that tells the user what to do
  • Select a data type that matches that of the dimension you will use
  • Load values into the parameter either typing directly or from the dimension
  • Click OK and you are done


2 Add the parameter to the viz


All you need to do is open the parameter pill and select Show Parameter Control


3-Use it in a calculation or a filter

After creating the parameter you need to use it - it is the calculation or the filter that affects the data in the viz - not the parameter by itself. 

Example 1 - Parameter driven T/F filter

The easiest way to use the parameter is in a True/False filter - the expression just says when the subcategory is equal to the one the user selected using the parameter return a True


Placed on the filter shelf and set to True will return this


Example 2 - Use it in a Set

The same parameter can be used to create a set - The Formula area on the Condition tab acts like an LOD -aggregate the dimension using Max or Min (sorry no Attr()) - set the Max subcategory to the parameter value to select the "In" value - all others are in the "Out"


a possible viz could compare the selected subcategory to all others


Example 3 - Change all views in a dashboard

Parameters are global - when the value is changed it changes all the calculations or filters where the parameter is used -

Bring the 2 worksheets together on a dashboard and changing the parameter value will affect both sheets without using filters or actions


Example 4 Top N filtering

Parameters can also take on numeric values like in the following Top N example 

Create a filter on Subcategory and open the Top tab 
Select Create From Parameter


When the window opens - select a starting value and a range


and create a viz 


The user can set the N from the control on the left - Note also the subcategory drop down will list all subcategories and has a reference to the Top N filter application 

Example 5 - Parameter Actions

With the 2019.2 release Parameter Actions were introduced given the user an easy visual way to change parameter values for the viz without opening a drop down - 

I will replace the parameter drop down from the earlier example with a value picker - a simple worksheet with the values (here subcategory names and a circle mark)   A horizontal will work well the the overall layout of the dashboard


Add the value picker to the dashboard and create a Parameter Action -

  • From the Dashboard on the upper ribbon select Action
  • Then Add - Change Parameter
  • Give the action a name
  • The source is - Value Picker 
  • The target is  Select Subcategory parameter


I used Hover for the example you can select what works best in your analysis


The value of the parameter and the viz will change as the user  hovers order the Value Picker marks - see the video


Have some fun with Parameter Actions -They are major enhancement  for the user experience

Example 6 Dynamic Parameters

Now the game changer - Dynamic Parameters - introduced with the 2020.1 release the parameter value list can be updated when the date source is updated and the workbook is opened - see how they work in the simple example below

In this example sales data is updated weekly - the initial load includes 4 dates 4/13-18 - the user wants to use a parameter to filter by individual date  - the viz looks something like this:


The dynamic parameter set up adds only a couple fields to the one you have used so far


  • the parameter that is to be updated and the field in the data set
  • initial value of the parameter (default is Current) 


In the example I added an LOD for the fixed max date in the data set - the parameter value will update to the latest date in the data set


When you update the data and when you reopen the book the parameter updates


NOTE - UPDATE     the 2020.3 release now will update the parameter and from a data source refresh or edit  - If you are on an earlier version see below

Desktop users - Note if working from a live data source and manually refresh the source you will need to close and reopen the Tableau workbook before the parameter updates

I hope this helps you understand parameters, parameter actions and dynamic parameters better  - I love using them - with a little practice you can too

The workbook examples used in the first part of this post can be found on my Tableau Public site at  https://public.tableau.com/profile/jim.dehner#!/vizhome/parameterworkbook/ValuePickerdrivendb?publish=yes

Enjoy

Jim


Post splash image

My Blog Has Moved