Showing posts with label Dates. Show all posts

Friday, June 12, 2020

FAQ - Convert String Dates

My blog has moved to jimdehner.com 

Thank you for all the support over the past 2 years - I recently updated my blog to make it easier to read, improve the rendering of images and tie back to video presentations that are associated with the content - Check it out at  Jim's new blog  -   


Dates are a special data type in Tableau the unique properties of being self-sequencing, sorting and can be used in date functions to set ranges, filter and aggregations.  But some legacy systems or public sources sometimes cast dates as a single string or individual strings for each date part.  Working with “real date” is much easier and converting strings to date is really not that difficult.

First – how do you know if your date is really text –


Open the Data Source Tab – the data may look like a date but if the Data Type is ABC then it has been loaded as a String


The first solution is to convert the data in the frame

Select the ABC icon and select Date for Discrete values and Date & Time for continuous values


What if the date is spread over several individual fields like Month,  - January, Quarter – Q3, Period – 2019Q2  and a year that may be a number or a String.  Those cases will require a calculation before converting to a real date.


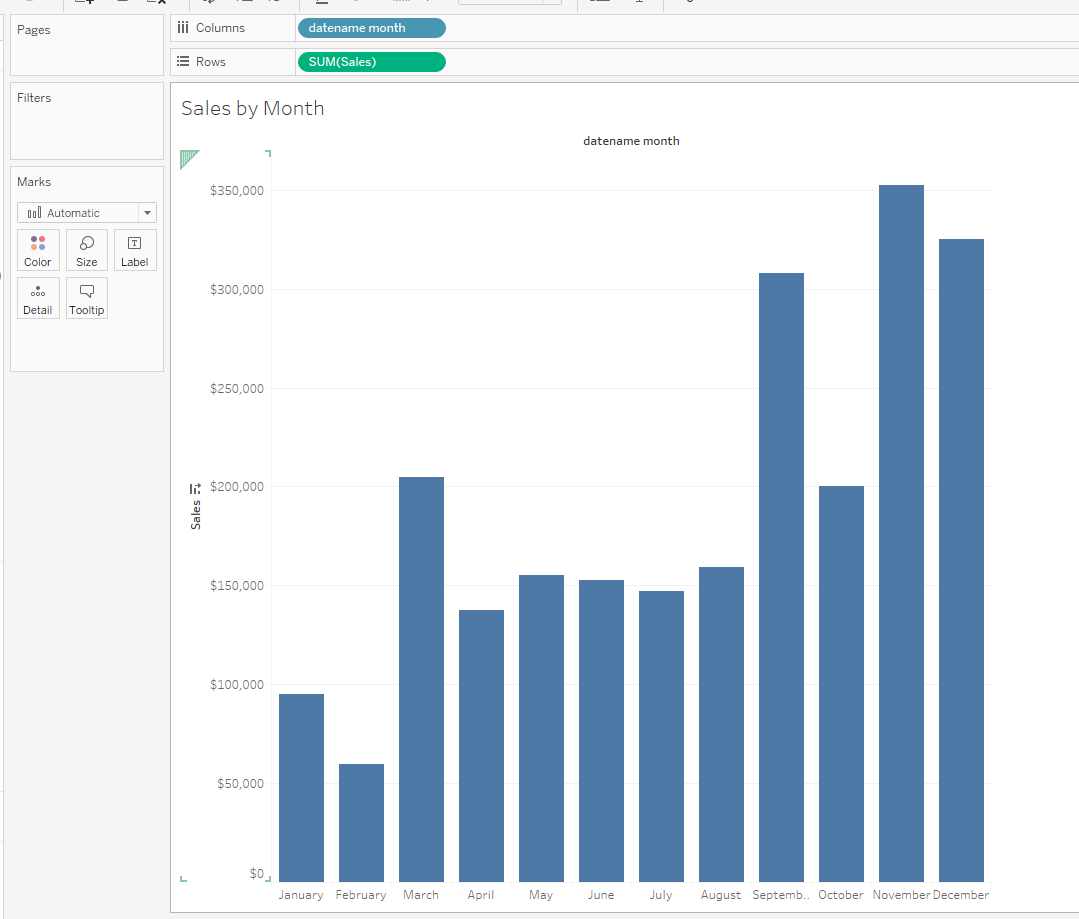
Month – year data entered as a String and Number


Can be converted to the first of the month with a Function – Date()


And it returns this


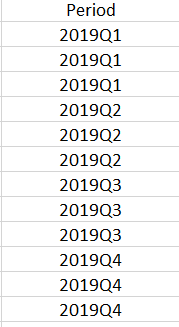
Occasionally periods are entered in a string – Dateparse is a function that can be used to convert data like this:


The expression may look complex but if you look at it in pieces -


The string in quotation just tells Tableau how the year – Month – and Date fields will be entered.

The Year is the first 4 characters of the Period field, the right 2 characters are the quarter designation – a Case statement will convert them  and the firs lot the month “01” is used for the day.


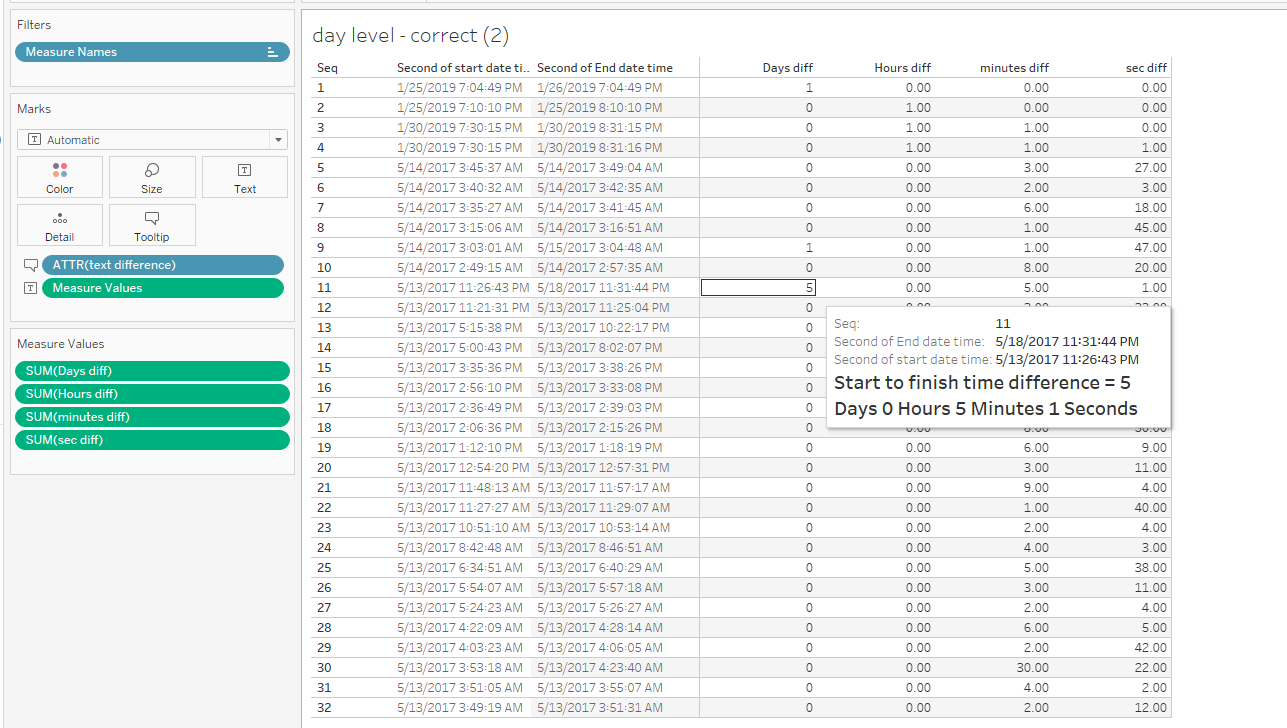
One final example – converting  timestamp dates to a duration – Some users have data that includes a start and end timestamp and need to determine the duration of an event – In days, hours, minutes and seconds

The data may look like this


One solution is to determine the duration at the lowest level – seconds and then convert the results into Days, Hours, Minutes, Seconds in separate calculations

Datediff will return the duration in seconds based on the start and end timestamps


Then number of days is simply the integer part of the total duration in seconds at divided by the number of seconds in a day – for example

Days =  Int([datediff at the second level]/(24*60*60))

For the remaining dateparts, make use of the Modulo function – Modulo returns the remainder of a division – e.g.   modulo will return 3 for 7/4 – So when dividing the total seconds by the number of seconds in a day modulo will return the number of seconds left over – dividing that number by the number of seconds in an hour (3600) and taking the integer value will return the number of hours 

Hours = INT(([datediff at the second level]%(24*(60)*60))/(60*60))

And

Minutes = INT(([datediff at the second level]%((60)*60))/(60))

And Seconds = INT(([datediff at the second level]%(60)))


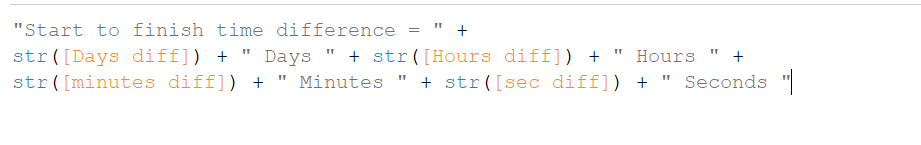
Finally – concatenating the parts together and adding the result to the tooltip


Hope this helps the next time you are faced with a Date field that was entered as text.  Now practice on some data of your own


Monday, February 10, 2020

Dates Functions and Other Necessary Evils

Dates Functions and Other Necessary Evils


I've had my "issues" with dates - maybe you have too - Date functions allow us to make spectacular charts, compare period sales and track trends over time.  But which one do you use and when?

Dates are a very special class of dimensions - they self sequence, have a built-in hierarchy, can be used as discrete or continuous dimensions, adjust to your fiscal year start and can be customized - pretty cool  - but the flexibility leads to confusion.  

This post will explore Date Functions - Formats and Custom Dates will be review in a future article 

Starting at the beginning - dates can take on 2 different forms - 
  • Date Parts categorize data and are discrete - bar charts, period analysis
  • Date values are a continuous form - make great line charts, trending 
Date Part

Dates in Tableau have a built in hierarchy that begin with Year and ends with Seconds


The various Date part functions have a similar format and truncate the date at the level selected

- using date part as an example - here the date dimension Start Date  is truncated at Year
The format for the level selected is always singular and is enclosed in single quote marks


Datepart('year',[start date])

It may be easier to see what the various levels will return from the chart below
Note the values returned using Datepart function are Integers - also note that Hour is based on a 24 hour clock 


There are also some date levels that are not part of the date hierarchy that are useful as you will see later 


Alternately you could use  Datename - returns the actual string (text) value of the level - January, Wednesday


For all the examples I will use the Superstore dataset that came with your copy of Tableau - you will be able to re-create examples

1 - Use Datepart to show Monthly sales

Start with a simple date function which truncates the date at the month level

DATENAME('month', [Order Date])


Create a viz using datename on columns and sum(sales) on rows


Datename is a discrete function that defaults to a bar chart - a discrete chart type - the bars present to total sales by month for all dates in the data set - 

You could create the same chart simply by dragging the Order date to columns and set the level to month-  When you do Tableau will default to a line chart - same numerical data just a continuous chart type - 


That's one of the confusing issues with dates - sometimes they default to discrete types and at others to continuous - easy enough to change in this example by changing the chart type to Bar - 

2 Year Month - When to use discrete chart types

If we add Year of order date you can begin to see where discrete chart types better represent the data 

This will place the Year for reach record (row) in the data 

DATENAME('year',[Order Date])

When applied to the previous month it is easy to see the progression of sales over the years and months


Adding year to the continuous chart also shows the progression but there is a discontinuity at the first of every year


The data are the same - the discrete date part calculation categorize data into year/month buckets - the bar chart (discrete) height represents to total for the month
The continuous chart type also present the monthly total but only the the marks at the month points are an accurate representation of the sales - the lines between just connect the marks and do not relate to sales on any day

3 YTD and YOY with Date Parts

Using DATEPART is one way to do a YTD and prior year to date analysis

Current Year Sales can be calculated as

if DATEPART('dayofyear',[Order Date])<=datepart('dayofyear',today())
and DATEPART('year',[Order Date])=datepart('year',today())
then [Sales]  else NULL end

Prior Year Sales as

if DATEPART('dayofyear',[Order Date])<=datepart('dayofyear',today())
and DATEPART('year',[Order Date])=datepart('year',today())-1
then [Sales]  else NULL end


then they can be presented in side by side charts as 


4 Day of Week Sales Heat Map

With the Week and Weekday options you could look at the how sales vary by day of the week over the 53 week year

The day of the week for each record is 

DATENAME('weekday',[Order Date])

and the week number can be determined datepart

datepart('week',[Order Date])


5 Days to Ship

A common metric for manufacturers is Days to Ship - here we will use it to illustrate a point about knowing the data elements in the data set

The function used is Datediff - it takes the difference in days (the date level) between the order and the ship date 

DATEDIFF('day',[Order Date],[Ship Date])

The function works at the row level - in the Superstore data set the data is kept at the product level - equivalent to row level data on the invoice - and orders may have several products

The measure the shipping department wants to be measured on is on the order level - the LOD below will return the days to ship for the order 

{ INCLUDE [Order ID]:AVG(DATEDIFF('day',[Order Date],[Ship Date]))  }


May not see like a lot - but if the metric is a department KPI it will be noticed

And you could come up with many more examples - remember that date part functions create dimensions that categorize the data at the row level and can be used like any other dimension in charts, graphs, calculations or filters

Date Values

Alternative date function formula can return a continuous value - 

If you are familiar with the date value and time value formulas in excel the concept is the same.  Date values increment daily time values are decimal parts of a day.  (Caution the starting point for Tableau and Excel are not the same so the actual values vary by a couple days)

The same array of levels are available for date values but the functions returns the first value in the level as a real date - an example will be clearer - using the same date chart as before


At each level the datetrunc formula will take the form of 

datetrunc('year',[Start Date])


Datetrunc will return the starting value of the selected level of the date hierarchy as a value out to the second 

Review the chart below and see how it differs for the earlier date part version of the same dates - 


Clearly the values are different - 

6 YTD using Datetrunc

This formula will return all records in the current year 

if DATETRUNC('year',[Order Date])=DATETRUNC('year',today()) then [Sales] end

The date level to display can be set by selection from the drop down list


And the data are plotted as a continuous line for each day of the current year - 


Now change the formula to include all prior years 

if DATETRUNC('year',[Order Date])<=DATETRUNC('year',today()) then [Sales] end

and at the day level the chart becomes


It may be too busy to be practical but easily changed to months


Note there are no breaks at the end of each year as there were with the discrete data part function - one of the advantages of using a continuous function

7 Trend lines

Trend lines can be added to any continuous graph directly from the Analytics tab 
Place the continuous month on columns and the measure on rows - then just drag the trend line to the canvas


8 Parameter Driven Continuous Line Charts

A poster to the Forum brought a particularly interesting challenge recently - they wanted a continuous chart that was driven by a parameter to select the level of the date and a second parameter to set the number of periods in the chart

The solution combines several of the concepts discussed

First create a parameter to change the date level from days - years


And a second parameter to allow the user to select how many periods to include in the chart


Next create a dimension based on the parameter that will be used as the continuous date axis in the chart 

Case for dimension;

date( CASE [Date level]                    
when "Day" then datetrunc('day',[Order Date])
when "Month" then datetrunc('month',[Order Date])
when "Week" then datetrunc('week',[Order Date])
when "Year" then datetrunc('year',[Order Date]) end  )


The statement might look intimidating but all is really does is use the Datetrunc function to create an axis for the chart at the level selected in the Date Level parameter.  

And finally a filter to determine which data to include 

Parameter Drive Filter:

            CASE [Date level]

When "Day"  then   datetrunc('day',( min([Order Date (Days)])))>=datetrunc('day',dateadd('day',-[lookback period],today()))
and  DATETRUNC('day',   min([Order Date (Days)]))<=datetrunc('day',today())

when "Month"  then   datetrunc('month',( min([Order Date (Days)])))>=datetrunc('month',dateadd('month',-[lookback period],today()))
and  DATETRUNC('month',   min([Order Date (Days)]))<=datetrunc('month',today())

when "Week"  then   datetrunc('week',( min([Order Date (Days)])))>=datetrunc('week',dateadd('week',-[lookback period],today()))
and  DATETRUNC('week',   min([Order Date (Days)]))<=datetrunc('week',today())

when "Year"  then   datetrunc('year',( min([Order Date (Days)])))>=datetrunc('year',dateadd('year',-[lookback period],today()))

and  DATETRUNC('year',   min([Order Date (Days)]))<=datetrunc('year',today()) end


Now that one is messy - but there are 4 similar segments each looks at a different date level and decides of the order date is within the lookback period the user wants to see - Once again using the continuous Datetrunc function

Then it is just a matter of placing everything on the viz


and the user can now dynamically change date levels and period from the 2 parameters 


There can by many more examples but the best way to learn about date functions is to use them - 

A workbook containing the examples shown here can be found at :

https://public.tableau.com/profile/jim.dehner#!/vizhome/DateFunctionExamples/SalesbyMonth


Feel free to download it and use it a template

Enjoy
Jim

Next: Date Formats and Custom Dates

Post splash image

My Blog Has Moved