Sunday, June 21, 2020

FAQ Series - Context filter - What do they really do?

In Tableau , like other languages, the sequence that filters or calculations are executed is controlled by the Order of Operations. The order starts with 3 filters – Extract filters limit the data passing from the data source to tableau, Data Source filters further limit data available in the workbook and can be specific to values within dimensions, and Context filters limit the data available to the remainder of the calculations, sets, Top N, dimension or measure filters or table calculations


But how exactly do context filters affect Top N and LOD expressions


The Context filters are applied in the step prior to creating sets, setting Top N filters and performing LOD calculations.  When a dimension is “placed in Context” and then the values are only the “un-filtered” data is available in the LOD or the Top N calculations


Let’s look at an example using an LOD with Superstore data using a Fixed expression that combines segments and category:


And a very simple text table viz:


Now apply a filter on Region and see the affect of the context filter


First filter out Central region with a normal dimension filter (after the context filter and the LOD expression are applied).  The results have not changed – the filter did not affect the LOD results (Often referred to as “Ignoring the filter”) 


Now place the region filter in Context so it is applied before the LOD is calculated:  And as expected the results from the LOD are now changed (they don’t include the Central region that was filtered out by the Context Region filter)


Top N Filters


The Top N filter option on sets and dimensional filters are also affected by the placement of a dimension in Context


Superstore data will be used in the example and the Top N option will be used on Sub-categories


Applying the filter on a text table and using year on columns results in


Out of context the East region is removed but the Top 3 sub-categories are unchanged -  That is because the Top N were determined before the dimension filter was applied


When Region is placed in context the East region is again removed but Tables now replace Storage – The Top 3 Total across the 3 regions are now Chairs, Phones and Tables – the East region was filtered out of the data in the Context filter before the Top N was determined.  Note also the values or Chairs and Phones in the other regions remains unchanged - 


The total across the 3 regions is calculated for each sub-category and it is the 3-region total that is used to determine the Top N

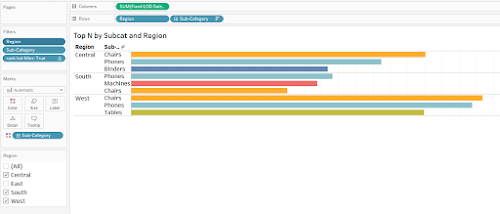
That may not be what you wanted – How would you determine the Top N subcategories based on their sales in each Region independently

That solution will required the use on an LOD and a Ranking function –


And


And a Filter based on the Rank


The LOD determines the sub-category sales in each region and then the Rank (a table calculation ) is applied


And filtering the East region removes if from the chart without affecting the top 3 determined by the rank in the other regions


Placing a dimension in the Context filter is a decision that you control – it changes the order in which filters are applied to the data table and the calculation results.  Make your decision on how you want the filter to act.


It may take a little practice, but you will get there in no time.


A downloadable workbook containing these examples can be found at :

 https://public.tableau.com/profile/jim.dehner#!/vizhome/ContexFilters/ContextFilters  


Jim


Friday, June 12, 2020

FAQ - Convert String Dates

My blog has moved to jimdehner.com 

Thank you for all the support over the past 2 years - I recently updated my blog to make it easier to read, improve the rendering of images and tie back to video presentations that are associated with the content - Check it out at  Jim's new blog  -   


Dates are a special data type in Tableau the unique properties of being self-sequencing, sorting and can be used in date functions to set ranges, filter and aggregations.  But some legacy systems or public sources sometimes cast dates as a single string or individual strings for each date part.  Working with “real date” is much easier and converting strings to date is really not that difficult.

First – how do you know if your date is really text –


Open the Data Source Tab – the data may look like a date but if the Data Type is ABC then it has been loaded as a String


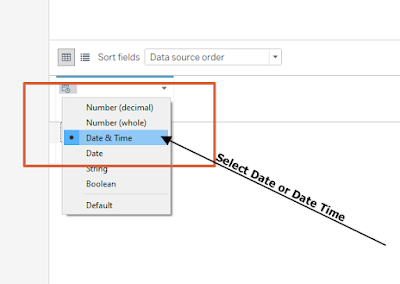
The first solution is to convert the data in the frame

Select the ABC icon and select Date for Discrete values and Date & Time for continuous values


What if the date is spread over several individual fields like Month,  - January, Quarter – Q3, Period – 2019Q2  and a year that may be a number or a String.  Those cases will require a calculation before converting to a real date.


Month – year data entered as a String and Number


Can be converted to the first of the month with a Function – Date()


And it returns this


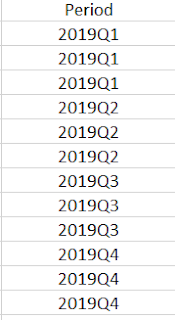
Occasionally periods are entered in a string – Dateparse is a function that can be used to convert data like this:


The expression may look complex but if you look at it in pieces -


The string in quotation just tells Tableau how the year – Month – and Date fields will be entered.

The Year is the first 4 characters of the Period field, the right 2 characters are the quarter designation – a Case statement will convert them  and the firs lot the month “01” is used for the day.


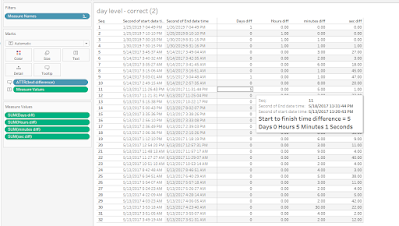
One final example – converting  timestamp dates to a duration – Some users have data that includes a start and end timestamp and need to determine the duration of an event – In days, hours, minutes and seconds

The data may look like this


One solution is to determine the duration at the lowest level – seconds and then convert the results into Days, Hours, Minutes, Seconds in separate calculations

Datediff will return the duration in seconds based on the start and end timestamps


Then number of days is simply the integer part of the total duration in seconds at divided by the number of seconds in a day – for example

Days =  Int([datediff at the second level]/(24*60*60))

For the remaining dateparts, make use of the Modulo function – Modulo returns the remainder of a division – e.g.   modulo will return 3 for 7/4 – So when dividing the total seconds by the number of seconds in a day modulo will return the number of seconds left over – dividing that number by the number of seconds in an hour (3600) and taking the integer value will return the number of hours 

Hours = INT(([datediff at the second level]%(24*(60)*60))/(60*60))

And

Minutes = INT(([datediff at the second level]%((60)*60))/(60))

And Seconds = INT(([datediff at the second level]%(60)))


Finally – concatenating the parts together and adding the result to the tooltip


Hope this helps the next time you are faced with a Date field that was entered as text.  Now practice on some data of your own


Post splash image

My Blog Has Moved