Recently there have been a number of Forum questions on converting time to duration
Time and duration are not the same - Time can be read from a clock - duration is the accumulation on intervals - and although we use a common terminology - hours - minutes and seconds they are different

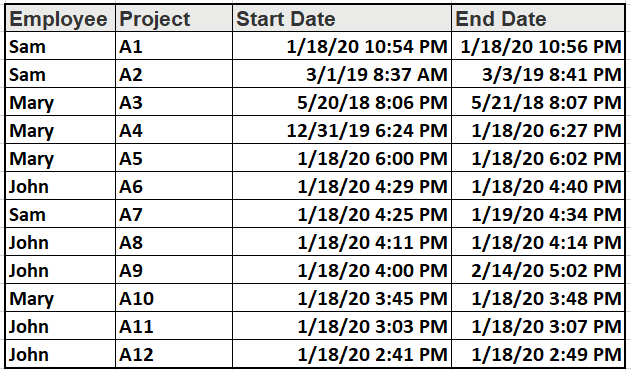
This example uses a simple data set consisting of project start and end times by employee
Date Functions - (see https://jimdehner2.blogspot.com/2020/02/dates-functions-and-other-necessary.html)
The date functions in Tableau are based on a truncating the date/time structure shown below
If you needed to determine the number of days between the start and end dates you could use
Datediff('day',[Start date],[End date])
and the value for project A9 would be - 27

but the actual interval is 27 days 1 hour 1 minute and 32 minutes
Increasing the number of decimal places will not change the result - Datediff truncated the value at the 'day' level

So how can we get Tableau to return the actual duration -
Determining the duration
The solution is to build the duration from the lowest level (grain) in the data - the example here is in seconds - Yours may differ and you can adjust the model as needed - also we will want to be able to calculate the duration at different levels in the data - this LOD will meet that need
{ INCLUDE [Employee],[Project]:sum( DATEDIFF('second',[Start Date],[End Date]) )}
The LOD will return the difference in seconds -

The duration are large and not what you want. They need to be converted to hours, minutes, and seconds
sum({ INCLUDE [Employee],[Project]:sum([datediff at the second LOD]%60)})%60
Again using an LOD to allow summing at different levels in the data - Note the use of MODULO - the function returns the remainder of the measure (here the total seconds) divided by the value that follows the % sign (60) - the LOD will first sum the remaining seconds at the level of the viz - the second use of modulo converts the total to minutes and seconds during the accumulation across the employee level and above.
The Duration in Minutes is
int(sum({ INCLUDE [Employee],[Project]:sum([datediff at the second LOD])/60 }) %60)
The Int() or Floor() will returns the integer portion of the calculation rounded down
The Duration in Days is
int(sum({ INCLUDE [Employee],[Project]:sum([datediff at the second LOD]) }) / (60*60*24))
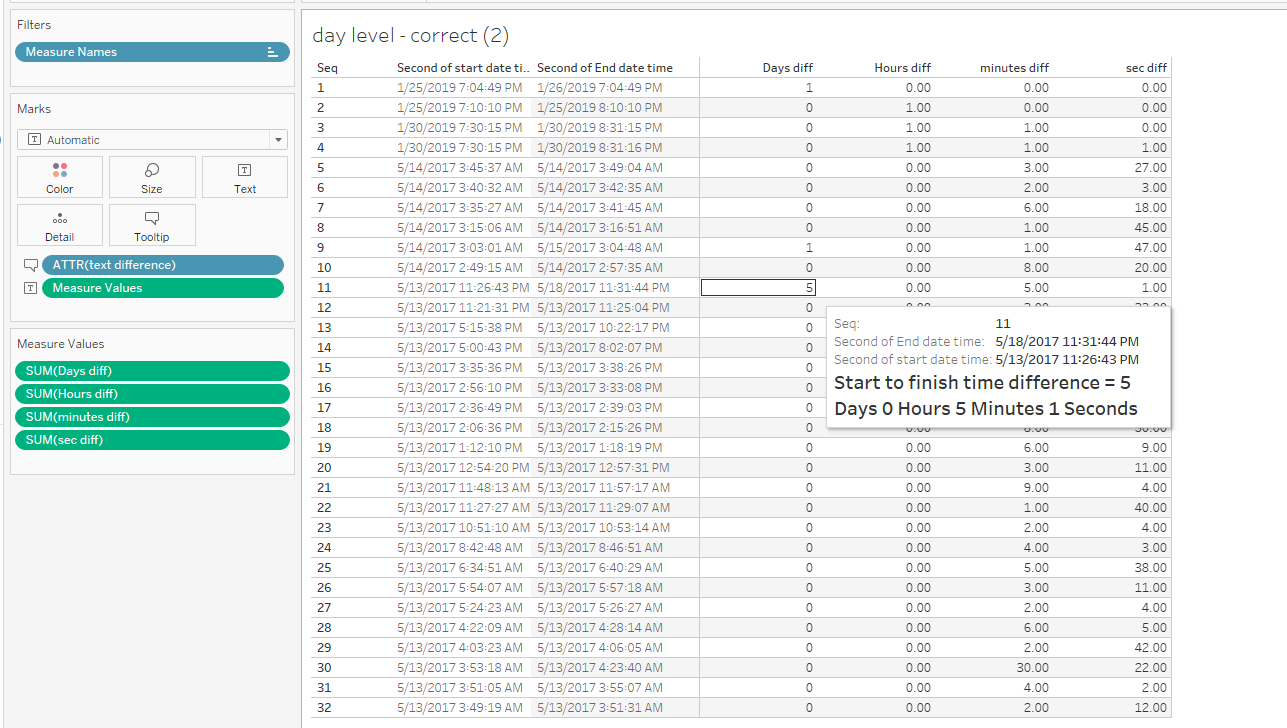
In text table form the viz is
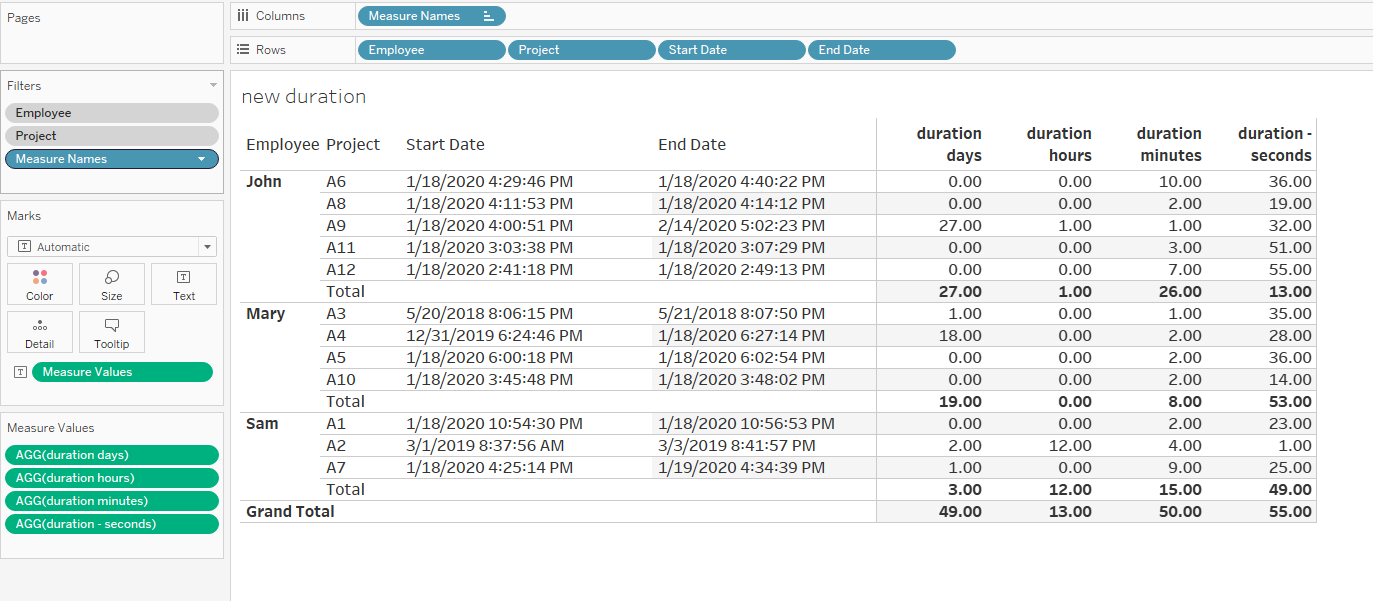

Format dd:hh:mm:ss
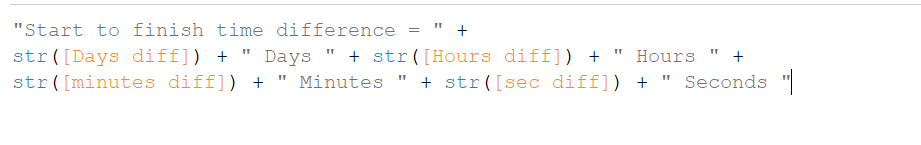
Often users have asked to have a format similar to dd:hh:mm:ss
str([duration days])+":" +str([duration hours])+":" +str([duration minutes])+":" +str([duration - seconds] )
The formula leverages the integer value in the LOD (integer) values and converting them to strings
and returns this in summary

Time and duration are not the same and it does take a few steps to getthe actual duration in a format the user expects - Hope this helps the next time you are faced with a similar problem
The workbook used in these examples can be found at
Enjoy
Jim