Tuesday, December 31, 2019

How-To Create a Normal Distribution Chart

My blog has moved to jimdehner.com 

Thank you for all the support over the past 2 years - I recently updated my blog to make it easier to read, improve the rendering of images and tie back to video presentations that are associated with the content - Check it out at  Jim's new blog  -   


How-To Create a Normal Distribution Chart

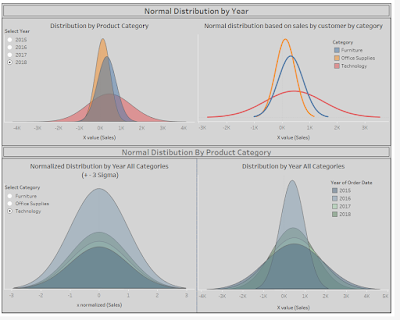
Occasionally there are Forum questions on creating normal distribution curves.  


The approach here relies heavily on the concept of data densification develop and refined by Bora Beran, Joe Mako, Jonathan Drummey, Ken Flerlage and others – Readers are encouraged to review their works on creating shapes and charts using the process.


This is a straightforward application of the normal distribution formula:
               
Y= (1/[σ*sqrt(2π])*e
Where  σ= Standard Deviation
                µ=Mean

You may find more elegant approaches – when you do please let me know so we all can benefit

The data used here is the “Superstore” data set that comes with Tableau desktop –  while the data set is detailed down to the transaction level the examples here go to the Year/Category level – the concept can be adapted to any level in the Superstore data set or your own

Overview –

Tableau does not draw curved lines – so we simulate the familiar smooth bell curve of the normal distribution with a series of straight lines  on an X-Y Cartesian coordinate grid.  The densification process is used to create intervals on the X-Axis (Sales in these examples).  As the number of intervals increases the plot becomes less angular. There is a parameter to adjust the number of intervals – somewhere between 50-100 intervals produces a reasonably smooth curve –play with it using your own data to see what works for you

– At this point if you have not familiar with Data Densification

STOP


and review one of the resources noted above. 

Step 1 Prepare the data for densification

Duplicate the data set by creating a union of the data with itself. Tableau will create a Dimension "Table Name" that can be used to distinguish the original data set from the duplicate - in the example the original data set is "Orders" and the duplicate in "Orders1"


Next create a calculation to define the ends point needed for the X-values

Path =   if [Table Name]="Orders1" then 1 else [max number of intervals] end

                Where [Max number of intervals] is the parameter to vary the x axis spacing

Use the Path formula to create bins –


Set the Bin Size to 1 - it will be the increment on the "X-axis" - (note I changed the bin name to Padded)


Step 2 – Create the X-values using the bins to pad the data – NOTE I used a +- 4 sigma range 

First, determine the µ and σ values – the average and the standard deviation values in this example on Sales – but we want to be able to vary the results by year and by category

For that use an LOD’s to create the needed combinations of year and category and the widow function forces the calculation to be executed in each bin across the viz

Mu=  window_min( avg({ FIXED year([Order Date]),[Category] :avg([Sales]) }) )

                Sigma= window_min(min({ FIXED year([Order Date]),[Category] :STDEV([Sales]) }) )

Where  (index()-1) is the bin number (interval) on the x axis

                X-value = (-4*[sigma])+([index-1 ]*(8*[sigma]))/window_max(max([Path])) 


Step 3 – Solve the Normal Distribution formula for Y 

Table calculations are used to determine then Y value at each bin (x-value)

For clarity there are 2 calculations 

The coefficient = (1/[σ*sqrt(2π])

                                 Coeff= 1/(sqrt(2*pi()*([sigma]^2)))

The Exponent =
                            Exponent = (-((([X value (Sales)])-[mu])^2)/((2*([sigma]^2)))  )

And then combined them in a single formula for Y (note Tableau does not have an "e" function but the EXP() will return the correct value)
                                                
Y= ([coeff]*EXP([exponent]) )


Step 4 – Create the viz –

Place the X and Y values on columns and rows then add the Mu and Sigma values to the Detail tile


Then add Padded (the bins) to the viz and set the calculation across the bins (all places)


You can also make normalized distribution charts using the formula below

                x-normalized = ([mu]-[X value (Sales)])/[sigma]

and replace the x-value in any of the charts


Finally, I added a parameter and a filter to allow the user to change the number of standard deviations visible in the charts
               
 N-Std Dev Filter =  [x normalized (Sales)] >= -[enter number of standard deviations] and              [x normalized (Sales)]<=[enter number of standard deviations]


Place it on the filter shelf – it too is a table calculation set to use Padded – then set to True 

The workbook containing these examples and more can be found on my Tableau Public site at https://public.tableau.com/profile/jim.dehner#!/vizhome/Howtocreateanormaldistributionchart_v2018_3/summary

Jim


YoY - Three different approaches

My blog has moved to jimdehner.com 

Thank you for all the support over the past 2 years - I recently updated my blog to make it easier to read, improve the rendering of images and tie back to video presentations that are associated with the content - Check it out at UPDATED blog post


Year over Year analysis - 3 different ways


As the year comes to an end a  frequent topic on the Forum is how to complete a YoY analysis - here we will look at 3 different approaches - one using table calculations, on with LOD's and a final way using sets and value pickers.


Table Calculations -  Easy but has its limits

The typical Forum question is how can I create a filter where the user can select a date and Tableau returns the year to date value for the current year and the previous year - Unfortunately, filters limit the data on the table that underlays the worksheet - Once data is filtered out of the table it is no longer available for use in determining the YTD or YoY values.
But the user can use a Parameter to set a date (or start and end dates) and base the YTD values on the parameter date.

Start by creating the parameter - set to select any date


next create a calculated field to add the YTD sales from the current and prior year based on the parameter

If  Datetrunc('year',([Order Date]))=Datetrunc('year',[Enter End Date ]) and
    Datetrunc('day', [Order Date])<= Datetrunc('day',[Enter End Date ]) 

OR 

   Datetrunc('year',([Order Date]))=Datetrunc('year',Dateadd('year',-1,[Enter End Date ])) and
   Datetrunc('day', [Order Date])<= Datetrunc('day',Dateadd('year',-1,[Enter End Date ])) 

then [Sales] end

and then create a viz - set the filter to include the years of interest and use the end data parameter - and the formula returns the YTD and PYTD sales values


Now you can add 2 table calculations using the lookup() function to return the YoY $ and % values


You can add the table calculations from the drop down or use the actual formula

The dollar difference is :
ZN(SUM([YTD  YOY on Parameter and filter]))
 - LOOKUP(ZN(SUM([YTD  YOY on Parameter and filter])), -1)

The % difference :
(ZN(SUM([YTD  YOY on Parameter and filter]))
 - LOOKUP(ZN(SUM([YTD  YOY on Parameter and filter])), -1)) /
 ABS(LOOKUP(ZN(SUM([YTD  YOY on Parameter and filter])), -1))


and when added to the table they return this


At this point most users want to eliminate the 2 blank columns for 2018 - that is one of the limitations of using table calculations - easy to use - but may not return the visual presentation you need

LOD Expressions - 

An alternative is use LOD expressions to specifically separate the current and prior year values.  Once again use the parameter to specify the end date - set the LOD to the Year and lowest level in your viz (sub-category here)  and the current YTD sales are 


{ FIXED Year([Order Date]),[Sub-Category]:
sum( if datetrunc('year',([Order Date]))=datetrunc('year', [Enter End Date ]) and
DATETRUNC('day', [Order Date])<= DATETRUNC('day',[Enter End Date ]) 

then [Sales] end)}


the Prior YTD sales are:

{ FIXED Year([Order Date]),[Sub-Category]:
sum( if datetrunc('year',([Order Date]))=
datetrunc('year', dateadd('year',-1,[Enter End Date ])) and
DATETRUNC('day', [Order Date])<= 
DATETRUNC('day',dateadd('year',-1,[Enter End Date ])) 

 then [Sales] end)}


The YoY $ difference is simply :

(sum([TYTD Sales LOD ])-sum([LYTD Sales LOD ]))

and the percent difference is:

(sum([TYTD Sales LOD ])-sum([LYTD Sales LOD ]))/sum([LYTD Sales LOD ])


they return this


The LOD's return separate values for the current and prior years so the difference in dollars and percent is a simple calculation based on the LOD - (for a complete discussion on writing LODs see  "Use LODs to create layer in your data set")


Sets and Set Actions

Sets can be used with an End Date parameter to separate the current and past year sales

you will need 2 sets on the date in your data - 


then on the Condition tab 


the formula should look familiar.  Current YTD is

Datetrunc('year',([Order Date]))=Datetrunc('year', [Enter End Date ]) and
Datetrunc('day', [Order Date])<= Datetrunc('day',[Enter End Date ])


and prior YTD is

Datetrunc('year',([Order Date]))=Datetrunc('year', Dateadd('year',-1,[Enter End Date ])) 
and Datetrunc('day', [Order Date])<= Datetrunc('day',Dateadd('year',-1,[Enter End Date ]))


then add formula for the current and prior year sales

(if [TYD Set On Date]  then zn([Sales]) end)


(if [LYTD Set on Date]  then zn([Sales]) end)


and for the dollar and percent difference

sum(zn([Sets TY YTD YoY $ ])) - sum(zn([Sets PY YTD  sales ]))

(sum(zn([Sets TY YTD YoY $ ])) - sum(zn([Sets PY YTD  sales ])))/
sum(zn([Sets TY YTD YoY $ ]))

and create the viz


So far we have created text table but you can also use other chart types to look at YoY data. Here is a Map that plots YoY $ difference at the state and product segment and subcategory levels

Just add 2 more sets - one on segment and the other on subcategory - just select any value when creating the sets (we will use set actions to change them later)


the current year sales based on the 3 sets is :

(if [TYD Set On Date] and [Segment set] and [subcat set] then zn([Sales]) end)

and the prior year sales

(if [LYTD Set on Date] and [Segment set] and [subcat set]  then zn([Sales]) end)

then percent difference is :

sum(zn([Sets date seg  TY YTD YoY $  ])) - sum(zn([Sets date seg  PY YTD  sales ]))


create a map by dragging State to the canvas


Create 2 value pickers - one for the segment set and the other for the sub category set
and pull them all together on a dashboard


See "See it your way using sets and set actions to navigate your next dashboard" for details on Set actions and value pickers


Hope this helps as you prepare YoY statements.  You can download the workbook with all of these examples form my Tableau Public sit at https://public.tableau.com/profile/jim.dehner#!/vizhome/YoY3waystoload/YOYDBwSetActions?publish=yes

Jim

Monday, December 16, 2019

Use sets and set actions to navigate your next viz

My blog has moved to jimdehner.com 

Thank you for all the support over the past 2 years - I recently updated my blog to make it easier to read, improve the rendering of images and tie back to video presentations that are associated with the content - Check it out at  Jim's new blog  -   


See it your way using sets and set actions to navigate your next dashboard -


There are 3 steps –

1.       Create sets on the dimensions you want to vary
2.       Use “Value Pickers” to visually change the set values
3.       Create the detail worksheet for your viz – here a map
4.       Add Set Actions to the dashboard

The example will use 3 dimensions – Market Segment, Product Subcategory and Region from the Superstore data set


Step 1 -Create the sets

For each dimension just open the pill and select Create Set


Then select any value to start - we will use Set Action to change them later


Step 2 Create visual value picker for each dimension

A Value Pick can be a simple as a worksheet that list the dimension values – you can use any shape I just chose Square here

Create a worksheet for each dimension and set combination

Add the Dimension to the Row or column shelf (based on how you want it to look on the dashboard later)


Repeat for each dimension


Step 3 – Create the map used in the viz

Drag the map to the canvas and add the 3 sets to the filter shelf 

– setting each set to “IN”  will only display the dimension values that have been selected to be in the set 
– applying all 3 will limit the view to the combination of values in the separate sets.


Step 4 Build the dashboard

Drag the map and the value pickers to the dashboard canvas. You may want to use containers to hold the value pickers -


Then for each dimension add a set action –


For each dimension you need a separate Set Action that ties the Value Picker to the Set
You can also decide to how to change the values - "On Selection" or "On Hover"


 the action will change the value of the set based on the user selection from the Value picker


That’s all it takes 


A workbook containing the model and “how to instructions can be found on my Tableau Public site at https://public.tableau.com/profile/jim.dehner#!/vizhome/DynamicSetActions/MixSets  Feel free to download it – or any other models on the site –

Enjoy

Jim
Wednesday, December 11, 2019

Use LODs to create layer in your data set

My blog has moved to jimdehner.com 

Thank you for all the support over the past 2 years - I recently updated my blog to make it easier to read, improve the rendering of images and tie back to video presentations that are associated with the content - Check it out at  Jim's new blog  -   


Need help using LOD’s – you’re not alone – But how can they be used


Think of your data set as a pyramid.  The data you upload creates the base of the pyramid – the top is the sum of all the data.  LOD expressions give you a way to create layers in your data and use those layers to categorizes data into dynamic groups, sets or ways to workaround the limitations of table calculations - 


LOD Syntax

LODs use a key word – Fixed, Include, or Exclude - followed by a list of dimensions which set the level of the virtual layer you want to create in the data set -  For example

                                {Fixed  [Segment], [Category]    :

In words it says “make all the combinations of Segment (3 in Superstore data)  and Category (3) ”  and create a layer that consists of 9 total values – then save them so they can be used later

The colon :   is the divider that ends the layer definition and starts the formula of the value to saved –

                                {Fixed  [Segment], [Category]    :   sum(Sales)} 

The result is a new layer in the data at the Segment/Category level


Creating multiple layers 

Adding dimensions before before the colon will define another layer in the data.  To create a new layer that includes Year level place the Year(order date) in the dimension list

{ FIXED [Segment],[Category],year([Order Date]): sum([Sales])}

Now in addition to layer at the Segment/Category level there is a layer at the Segment/Category/Year level


Filtering and the Order of Operation

LOD expressions can be filter but the results will be affected if dimensions placed in the Context Filter

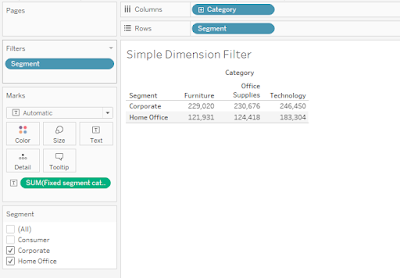
First use a simple filter on a Dimension in the LOD expression – ( Segment ). The results are filtered as you would expect – the Consumer Segment is filtered out of the data – Three of the 9 values of the Segment/Category are filtered out of the result


Context filters affect

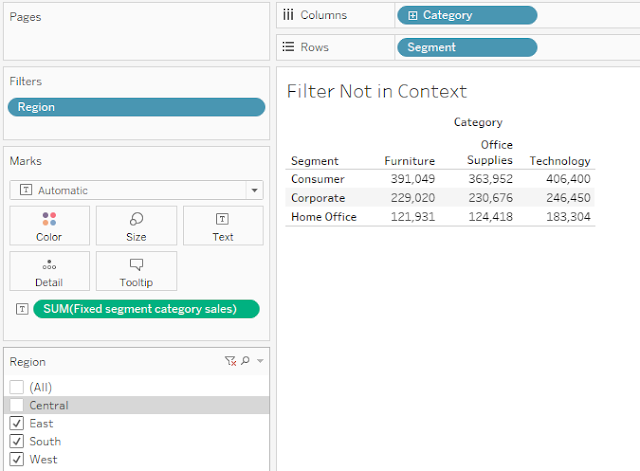
Add a filter for a Dimension not in the LOD expression Region in the example – filter the Central region and the 9 values from the LOD are NOT changed -


Change the Region filter to Context – the results do change


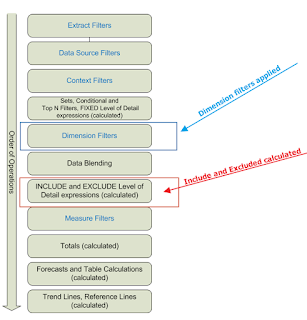
What’s going on?  The  position of the Context filter in Order of Operation causes the results to change.


Context filters are applied BEFORE the LOD calculation in the Order of Operation – if a dimension is placed in Context Tableau will apply the filter before the LOD is calculated –

In this case – the Central Region is filtered out before calculating the Segment/Category LOD

Dimension filters are applied AFTER the LOD is calculated – the results reflect the un-filtered Segment/Category LOD


You control when the filters are applied – there is no single correct way – it depends on the result you expect

Use in other calculations

LODs place a value that is aggregated in new virtual layer in the data set, but they are NOT aggregates in themselves.   That’s powerful! 


Replacing Table calculations

A FAQ on the Forum is how to fix a table calculation – but they are built on the table that underlays each worksheet and can’t be carried form one sheet to another.  

LOD’s can be used to "Fix" some table calculations - for example Percent of total 

The table calculation formula for percent of total used Total() and is then calculated down (in this example)

SUM([Sales]) / TOTAL(SUM([Sales]))

LOD’s can be used in the to replace the numerator and denominator

                sum({ FIXED [Segment],[Category]: sum([Sales])})/sum({ FIXED [Category]: sum([Sales])})


The LOD base Percent of Total and now Fixed at the Segment/Category level 

Nested LOD and Table Calculation

LODs can be also be nested directly in Table Calculations - This example dynamically ranks Sub-Category based on annual sales

The LOD below will total Sales at the Sub-Category/Year level

{ FIXED [Sub-Category],Year([Order Date]):sum([Sales])}

Nesting the LOD in a Ranking function (Table Calculation)  will sequence the categories descending each year

RANK_UNIQUE(sum([fixed annual category sales]),'desc')

And return this


LODs in conditional statements and grouping

Need to separate records into groups based on the value of a single dimension?

Use a conditional statement (  if…then  ) in the aggregation portion of the LOD  (after the :  )
This says “for each order and category combination – separate out the Furniture lines and group the remaining as “Other”

      { FIXED [Order ID],[Category] : min(if [Category]="Furniture" then [Category] else "Other" end  ) }

The LOD will categorize each Order/Category combination into one of 2 groups – you can use the LOD like any other dimension in you viz


Include and Exclude LODs


Where Fixed works above the dimension filters in the order of operations Include and Exclude work after the dimension have been applied


Using the same Segment/Category but adding the Include and Exclude version we can see the effect of the LOD

{ FIXED [Segment],[Category]: sum([Sales])}

{ EXCLUDE   [Segment],[Category]: sum([Sales])}

{ INCLUDE  [Segment],[Category]: sum([Sales])}

Include is applied after the dimension filter  Year(order date) is applied and sums at the  Segment/Category for each year

Exclude applies the totals after the Year(order date) is applied and sums across all the Segment/Categories at the year level


I hope this give you a better idea of how LOD expressions give you the flexibility to add different levels in your data set.  They are a powerful tool that can be used in conjunction with conditional statements, table calculations or nested in other LODs.  

Have fun - the best way to learn more is to use them with some simple example 

A Tableau workbook with copies of the examples presented here can be found on my tableau public site   https://public.tableau.com/profile/jim.dehner#!/vizhome/LayeryourdatawithLODs/FixedSegCatyrsumsales

Jim


Post splash image

My Blog Has Moved