My blog has moved to jimdehner.com
Thank you for all the support over the past 2 years - I recently updated my blog to make it easier to read, improve the rendering of images and tie back to video presentations that are associated with the content - Check it out at Jim's new blog -
Need help using LOD’s – you’re not alone – But how can they be used
Think of your data set as a pyramid. The data you upload creates the base of the
pyramid – the top is the sum of all the data.
LOD expressions give you a way to create layers in your data and use
those layers to categorizes data into dynamic groups, sets or ways to
workaround the limitations of table calculations -
LOD Syntax
LODs use a key word – Fixed, Include, or Exclude -
followed by a list of dimensions which set the level of the virtual layer you
want to create in the data set - For
example
{Fixed [Segment], [Category] : …
In words it says “make all the combinations of Segment (3 in Superstore data) and Category (3) ” and create a layer that consists of 9 total values – then save them so they can be used later
The colon : is the
divider that ends the layer definition and starts the formula of the value to
saved –
{Fixed [Segment], [Category] : sum(Sales)}
The result is a new layer in the data at the Segment/Category level

Creating multiple layers
Adding dimensions before before the colon will define another layer in the data. To create a new layer that includes Year level place the Year(order date) in the dimension list
{ FIXED [Segment],[Category],year([Order Date]): sum([Sales])}
Now in addition to layer at the Segment/Category level there is a layer at the Segment/Category/Year level

Filtering and the Order of Operation
LOD expressions can be filter but the results will be affected if dimensions placed in the Context Filter
LOD expressions can be filter but the results will be affected if dimensions placed in the Context Filter
First use a simple filter on a Dimension in the LOD expression – (
Segment ). The results are filtered as you would expect – the Consumer Segment
is filtered out of the data – Three of the 9 values of the Segment/Category are
filtered out of the result

Context filters affect
Add a filter for a Dimension not in the LOD expression
Region in the example – filter the Central region and the 9 values from the LOD
are NOT changed -
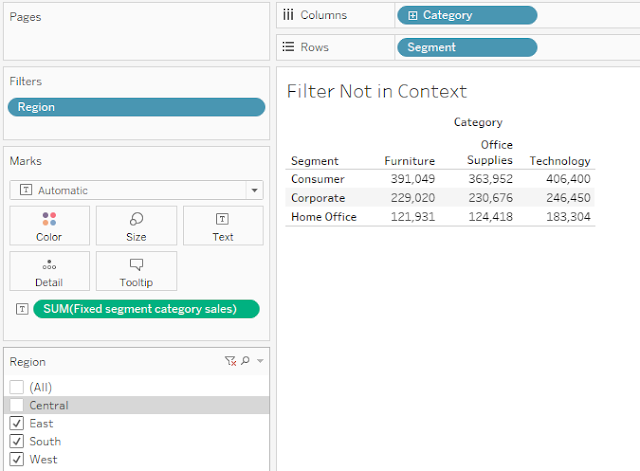

Change the Region filter to Context – the results do
change

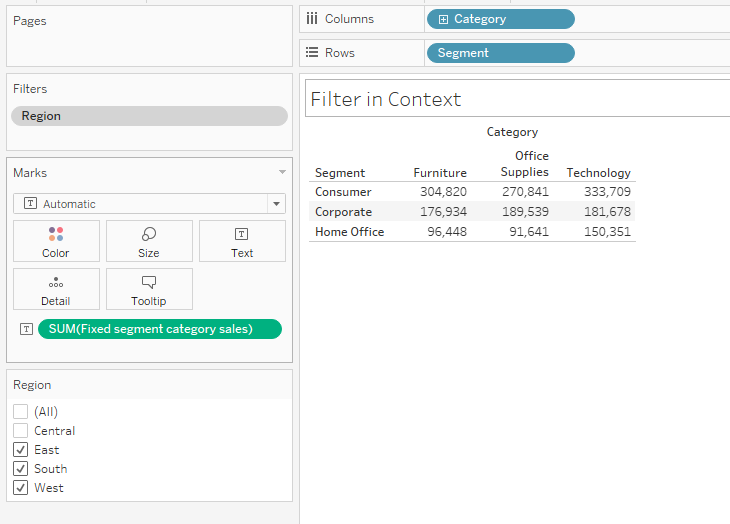
What’s going on? The position of the Context filter in Order of Operation causes the results to change.

Context filters are applied BEFORE the LOD calculation in
the Order of Operation – if a dimension is placed in Context Tableau will apply
the filter before the LOD is calculated –
In this case – the Central
Region is filtered out before calculating the Segment/Category LOD
Dimension filters are applied AFTER the LOD is calculated –
the results reflect the un-filtered Segment/Category LOD
You control when the filters are applied – there is no single correct way – it depends on the result you expect
Use in other calculations
LODs place a value that is aggregated in new virtual layer
in the data set, but they are NOT aggregates in themselves. That’s powerful!
Replacing Table calculations
A FAQ on the Forum is how to fix a table calculation – but
they are built on the table that underlays each worksheet and can’t be carried
form one sheet to another.
LOD’s can be used to "Fix" some table calculations - for example Percent of total
LOD’s can be used to "Fix" some table calculations - for example Percent of total
The table calculation formula for percent of total used
Total() and is then calculated down (in this example)
SUM([Sales]) /
TOTAL(SUM([Sales]))
LOD’s can be used in the to replace the numerator and
denominator
sum({
FIXED [Segment],[Category]: sum([Sales])})/sum({ FIXED [Category]:
sum([Sales])})

The LOD base Percent of Total and now Fixed at the Segment/Category level
Nested LOD and Table Calculation
LODs can be also be nested directly in Table Calculations - This example dynamically ranks Sub-Category based on annual sales
LODs can be also be nested directly in Table Calculations - This example dynamically ranks Sub-Category based on annual sales
The LOD below will total Sales at the Sub-Category/Year
level
{ FIXED [Sub-Category],Year([Order
Date]):sum([Sales])}
Nesting the LOD in a Ranking function (Table
Calculation) will sequence the
categories descending each year
RANK_UNIQUE(sum([fixed annual
category sales]),'desc')
And return this


LODs in conditional statements and grouping
Need to separate records into groups based on the value of a
single dimension?
Use a conditional statement ( if…then
) in the aggregation portion of the LOD
(after the : )
This says “for each order and category combination –
separate out the Furniture lines and group the remaining as “Other”
{ FIXED [Order
ID],[Category] : min(if [Category]="Furniture" then [Category] else
"Other" end ) }
The LOD will categorize each Order/Category combination into
one of 2 groups – you can use the LOD like any other dimension in you viz

Include and Exclude LODs

Where Fixed works above the dimension filters in the order of operations Include and Exclude work after the dimension have been applied
Using the same Segment/Category but adding the Include and Exclude version we can see the effect of the LOD
{ FIXED [Segment],[Category]:
sum([Sales])}
{ EXCLUDE [Segment],[Category]: sum([Sales])}
{ INCLUDE [Segment],[Category]: sum([Sales])}
Include is applied after the dimension filter Year(order date) is applied and sums at
the Segment/Category for each year
Exclude applies the totals after the Year(order date) is
applied and sums across all the Segment/Categories at the year level


I hope this give you a better idea of how LOD expressions
give you the flexibility to add different levels in your data set. They are a powerful tool that can be used in
conjunction with conditional statements, table calculations or nested in other
LODs.
Have fun - the best way to learn more is to use them with some simple example
Have fun - the best way to learn more is to use them with some simple example
A Tableau workbook with copies of the examples presented
here can be found on my tableau public site
Jim


No comments:
Post a Comment
Note: Only a member of this blog may post a comment.