My blog has moved to jimdehner.com
Thank you for all the support over the past 2 years - I recently updated my blog to make it easier to read, improve the rendering of images and tie back to video presentations that are associated with the content - Check it out at Jim's new blog -
"Zoom In" - to Points on Map

Not an un-common question – and very solvable with Tableau - but being able to "Zoom in" requires a bit of a hack
To get the solution we need to determine the distance from each office location to every client site and will require connecting the files together with a Cartesian join

The join expands the data set with a separate row for each client location / office site combination

Step 2 – Determine the distance from the office to each client
I’ve used an LOD that looks at each Office location and determines the distance to every Client location
{ FIXED [Client Loc ID],[Office Loc ID] :avg(3959 * ACOS(
SIN(RADIANS([Client Lat])) * SIN(RADIANS(([Office Lat]))) +
COS(RADIANS([Client Lat])) * COS(RADIANS(([Office Lat]))) *
COS(RADIANS(([Office Long]))-RADIANS([Client Long]))) )}
Note: I used the explicit formula rather than the Distance spatial function added in version 2019 -
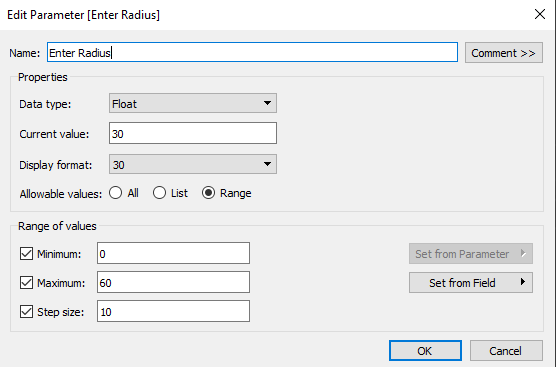
Step 3 Create a Parameter to enter the radius and a filter based on the parameter
I used a floating point parameter and used a range up to 60 miles with steps of 10 miles – you can use whatever fits your analysis
Then add a simple filter that limits the distance between the city center to the value in the parameter – place it on the filter shelf and set to TRUE
[Distance Office to Client]<= [Enter Radius]
Step 4 - Create the Map
The Viz is a dual axis map - one layer contains the Client locations the other the Office sites
Filters are added on the Office site location and the Boolean distance filter. I made the Office locations stars - could be any shape - and I use the State dimension to vary the color of the client locations

Convert the map to Dual Axis then go to the Map button on the top ribbon, open and select Map Layers - in the box that opens you will be able to select the style and the layers you want to see

Step 5 - the Zoom feature
Finally the Zoom feature is controlled by the radius - the smaller the radius the more the user "Zooms" in and conversely larger radii will "Zoom Out" BUT you MUST UNPIN the map and UNSELECT the Pan and Zoom on the Map Options to avoid the map being locked at a zoom level and office location

Bring the map and filter and parameter to a dashboard and annotate as needed

https://public.tableau.com/profile/jim.dehner#!/vizhome/Findclientswithinradius_v10_5/Interactivemap
Feel free to download it (or any other file on the site) to use as a model
Jim


No comments:
Post a Comment
Note: Only a member of this blog may post a comment.